
Figure 1. Chromosome conformation and gene regulatory mechanisms.
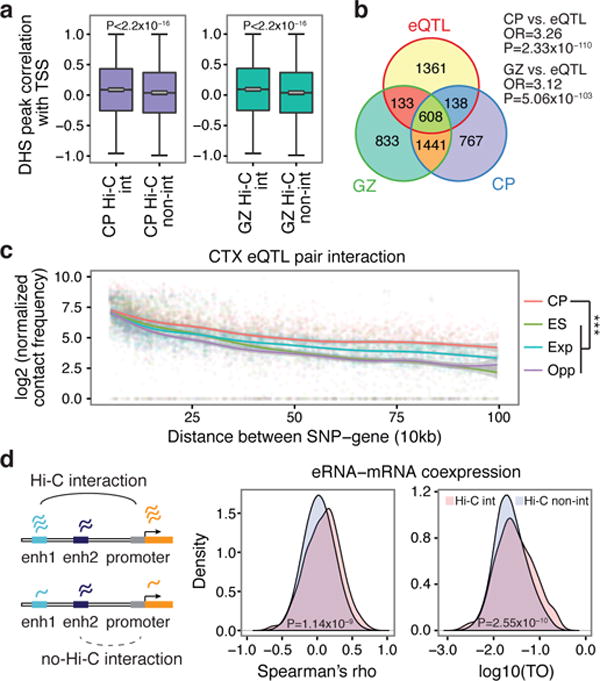
a, DHS peak correlations with the transcription start site (TSS) for putative enhancers that physically interact with promoters by Hi-C (Hi-C int.) vs not (Hi-C non-int.). P values calculated by t-test from correlation values converted to Z scores; whiskers, 1.5 × interquartile range; centre lines, median (black) and mean (grey). b, Overlap between eQTL transcripts and genes physically interacting with eQTL in CP and GZ (Fisher’s test). OR, odds ratio. c, Hi-C interaction frequency between eQTL and associated transcripts. Chromatin contact frequency in CP and ES; Exp., expected interaction frequency; Opp., (opposite) interaction frequency of SNPs and transcripts when the position of genes was mirrored relative to the eQTL. ***P < 0.001, repeated measures ANOVA. LOESS curves and confidence intervals (95%, shaded area) are depicted. d, Hi-C interacting enhancer–gene pairs show increased expression correlation (Spearman, middle) as well as co-expression (TO, topological overlap, right) compared with non-interacting pairs (Wilcoxon signed-rank test).