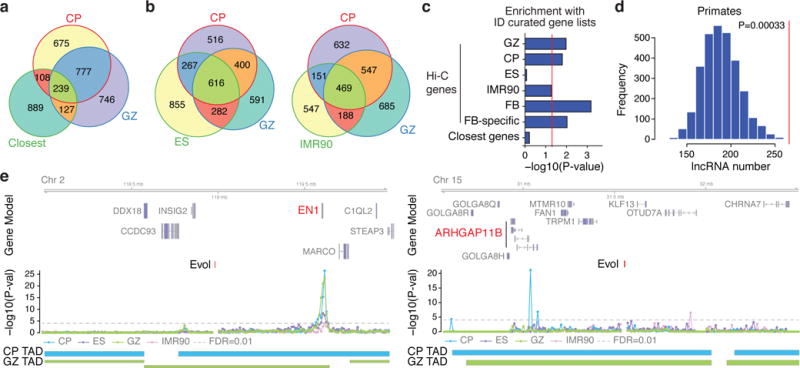
Figure 2. Regulatory architecture of human-gained enhancers.

a, b, Overlap between Hi-Cevol genes in CP and GZ with the closest genes (a) and Hi-Cevol genes in ES (left) and IMR90 (right, b) cells. c, Overrepresentation of Hi-Cevol genes in different tissues and closest genes with ID risk genes. GPCR, G-protein coupled receptor; Hi-C genes: GZ, CP, ES, IMR90, Hi-Cevol genes in each cell type; FB (fetal brain), union of Hi-Cevol genes in GZ and CP; FB-specific, Hi-Cevol genes in FB only; Closest genes, closest genes to human-gained enhancers. d, Number of primate-specific lncRNAs interacting with human-gained enhancers in CP (a red vertical line in the graph) against permuted background. e, Representative interaction map of a 10 kb bin, in which human-gained enhancers reside, with the corresponding flanking regions. Chromosome ideogram and genomic axis on the top, possible target genes marked in red; genomic coordinates for human-gained enhancers are labelled as Evol; –log10[P value], significance of the interaction between human-gained enhancers and each 10 kb bin; grey dotted line marks FDR = 0.01; TAD borders in CP and GZ below.
