
Extended Data Figure 2. Inter-chromosome conformation is associated with various genomic features.
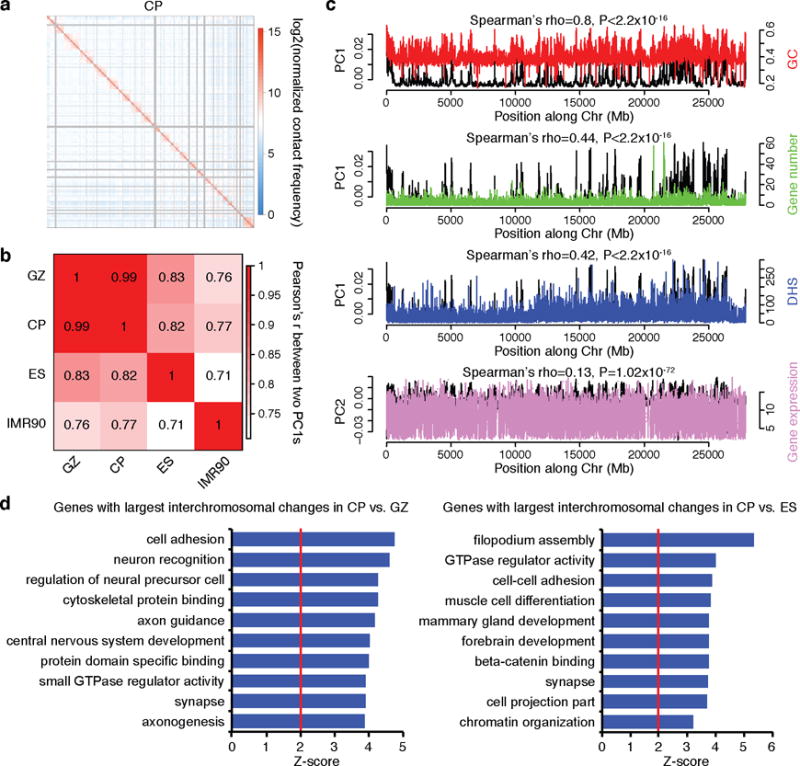
a, Representative heat map of the chromosome contact matrix of CP. Normalized contact frequency (contact enrichment) is colour-coded according to the legend on the right. b, Pearson correlation of the leading principle component (PC1) of inter-chromosomal contacts at 100 kb resolution between in vivo cortical layers and non-neuronal cell types (ES and IMR90). PC1s from neuronal tissues (CP and GZ) have significantly higher correlation than the PC1s between non-neuronal cell types, consistent with the higher similarity between tissues from brain vs the two other cell lines, although batch effects are also likely to contribute. c, Spearman correlation of PC1 of chromatin interaction profile of fetal brain (GZ) with GC content, gene number, DHS of fetal brain, and gene expression level in fetal laminae. d, GO enrichment of genes located in the top 1,000 highly interacting inter-chromosomal regions specific to CP vs GZ (left), and CP vs ES (right), indicating that genes located on dynamic chromosomal regions are enriched for neuronal development.