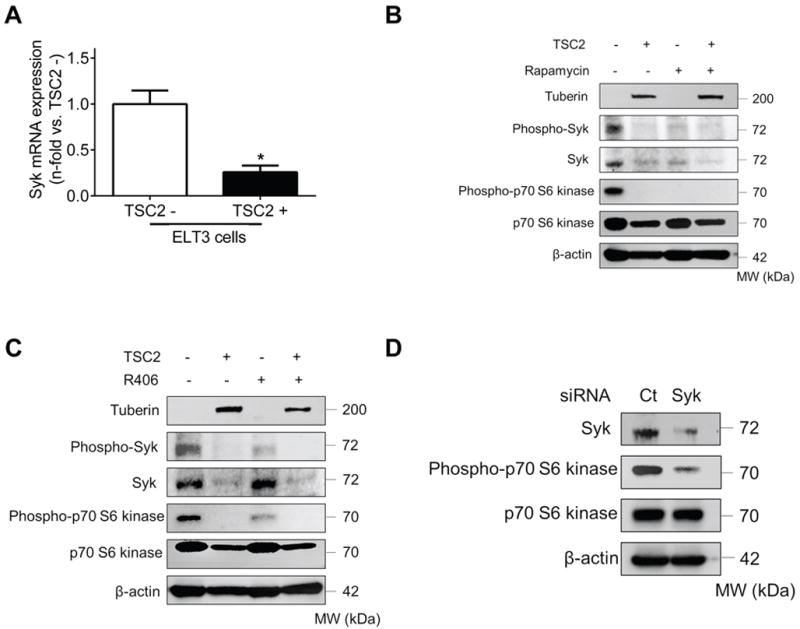
Fig. 1. TSC2-deficient cells display deregulated Syk expression and activation.

(A) Real-time PCR analysis of rat Syk mRNA in TSC2- cells compared to TSC2+ cells. Results were expressed as the fold change relative to TSC2- cells. Data represent means ± SEM of three independent experiments. * P < 0.05, by Student’s t test. (B) TSC2- and TSC2+ cells were treated with either control vehicle (DMSO) or rapamycin (20 nM) for 24 h. (C) TSC2- and TSC2+ cells were treated with either control vehicle (DMSO) or R406 (1μM) for 24 h. (D) TSC2- cells were transfected with control siRNA (Ct) or Syk siRNA for 48 h. (B to D) Equal amounts of protein from whole cell lysates were analyzed by Western blot using antibodies against Tuberin, Phospho-Syk, Syk, Phospho-p70 S6 Kinase and p70 S6 Kinase. β-actin was used as a loading control. All experiments were repeated at least three times.
