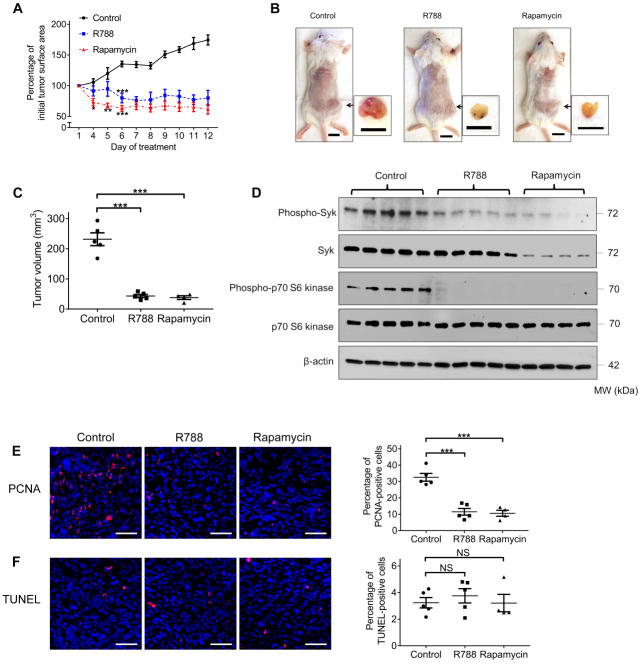
Fig.3. Syk inhibition impairs TSC2-null xenograft tumor development.
Female CB17-SCID mice were inoculated with TSC2- cells subcutaneously. Mice were treated with control vehicle (n=5), R788 (n=5), or rapamycin (n=4) through intraperitoneal injection after tumor surface area reached 40 mm2. (A) Tumor surface area was measured daily with a caliper and tumor growth curve was plotted. Results were expressed as a percentage of baseline tumor surface area before treatment. (B) Mice were sacrificed 12 days after the initial treatment. Representative gross appearance of mice bearing xenograft tumors and excised tumors is displayed. Scale bars: 1 cm. (C) Volume of the excised tumors. (D) Equal amounts of protein from tumor homogenates were analyzed by Western blot using antibodies against Phospho-Syk, Syk, Phospho-p70 S6 Kinase and p70 S6 Kinase. β-actin was used as a loading control. (E) Left panel: representative images of PCNA (red) immunofluorescence staining in tumor tissue. Right panel: percentage of PCNA-positive cells. (F) Left panels: representative images of TUNEL (red) staining in tumor tissue. Right panel: percentage of TUNEL-positive cells. Nuclei were counterstained with DAPI (blue). Scale bars: 50 μm (E and F). Data are presented as the mean ± SEM. NS, not significant, *P < 0.05, **P < 0.01, ***P < 0.001 (versus control), by one-way ANOVA.

