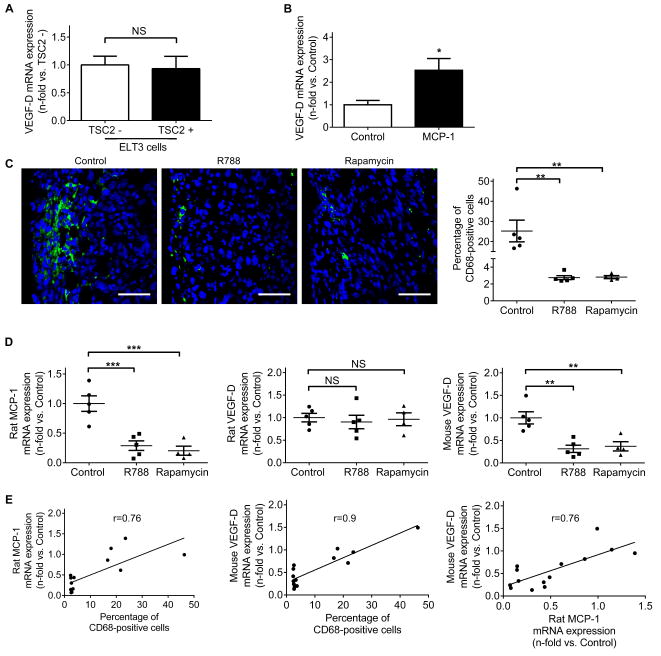
Fig.5. MCP-1 stimulates VEGF-D expression in peripheral blood mononuclear cells.
(A) Real-time PCR analysis of rat VEGF-D mRNA in TSC2- cells compared to TSC2+ cells. Results were expressed as the fold change relative to TSC2- cells. (B) Real-time PCR analysis of human VEGF-D mRNA in human peripheral blood mononuclear cells (PBMCs). PBMCs from four LAM subjects were isolated, seeded and stimulated with recombinant human MCP-1 (10 ng/ml) for 24 h. Results were expressed as the fold change relative to PBMCs treated with control vehicle. (A and B) Data represent means ± SEM of three independent experiments. NS, not significant, * P < 0.05, by Student’s t test. (C) Left panels: Representative images of CD68 (green) immunofluorescence staining on TSC2-null tumor edges. Nuclei were counterstained with DAPI (blue). Scale bars: 50 μm. Right panel: percentage of CD68-positive cells. (D) Real-time PCR analysis of rat MCP-1(left panel), rat VEGF-D (middle panel) and mouse VEGF-D (right panel) mRNA in tumor homogenates. (C and D) Data are presented as the mean ± SEM. NS, not significant, **P < 0.01, ***P < 0.001 (versus control), by one-way ANOVA. (E) Correlation between percentage of CD68-positive cells, rat MCP-1 mRNA expression and mouse VEGF-D mRNA expression in tumors. Correlation coefficients between two variables were calculated with Pearson correlation test.

