. 2017 Mar 13;6:e23816. doi: 10.7554/eLife.23816

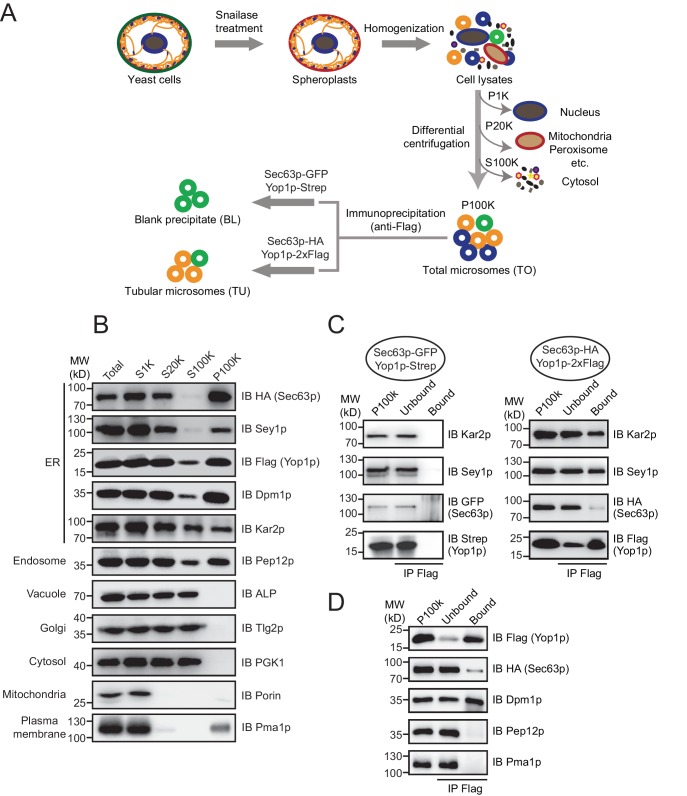
Figure 1. Immunoisolation of Yop1p-containing microsomes.

(A) Schematic diagram of tubular ER isolation. P1K, P20K, and P100K represent the pellets of solutions centrifuged at 1000 x g, 20,000 x g, and 100,000 x g, respectively. S100K is the supernatant of the solution centrifuged at 100,000 x g. (B) Microsome preparation by step centrifugation. Samples from each step were immunoblotted using the indicated antibodies. Total, total cell lysates; S1K, S20K, S100K, and P100K are defined as in (A). (C) Sec63p-GFP/Yop1p-Strep or Sec63p-HA/Yop1p-2xFlag was co-transformed into yeast cells. Microsomes were prepared and subsequent immunoprecipitation (IP) performed using anti-Flag agarose beads. The samples were analyzed by SDS/PAGE and immunoblotting (IB). (D) As in (C), but with the addition of other organelle makers. The data shown in B-D are representative of at least three repetitions.

DOI: http://dx.doi.org/10.7554/eLife.23816.002

Figure 1.

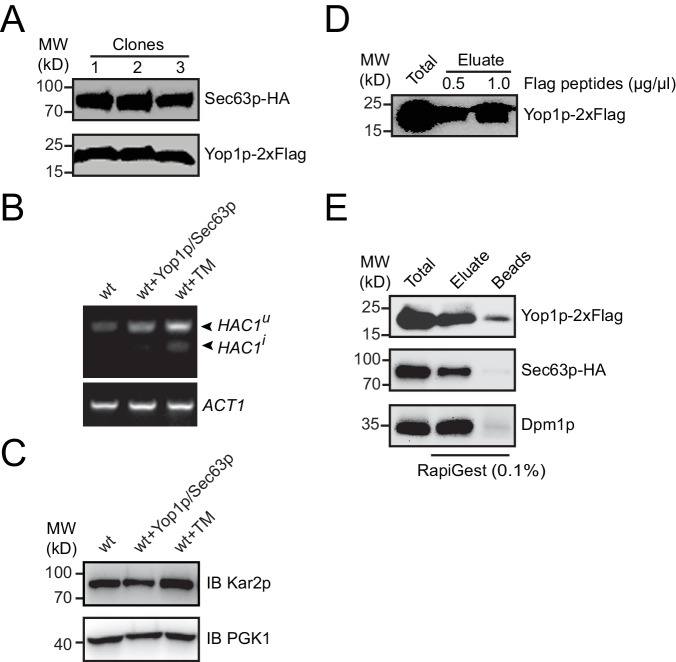
Figure 1—figure supplement 1. Protein expression and immunoprecipitated sample elution.

Figure 1—figure supplement 1.

(A) HA-tagged Sec63p and Flag-tagged Yop1p were transformed into yeast cells with their endogenous promoter. Sec63p-HA and Yop1p-2xFlag levels were analyzed in three different clones by immunoblotting. (B) In cells with or without ectopic Yop1p and Sec63p expression, HAC1 mRNA was reverse transcribed and amplified by PCR. When indicated, tunicamycin (Tm) was added at 4 μg/mL for 1 hr. HAC1u, uninduced HAC1; HAC1i, induced HAC1. ACT1 was analyzed as an internal RNA control. (C) Kar2p levels were analyzed by immunoblotting cells tested in (B). PGK1 was used as a loading control. (D) Immunoprecipitated samples were eluted by Flag peptides and analyzed by Western blotting. The data are representative of three repetitions. (E) As in (D), but eluted by 0.1% RapiGest SF.