. 2017 Mar 13;6:e23816. doi: 10.7554/eLife.23816

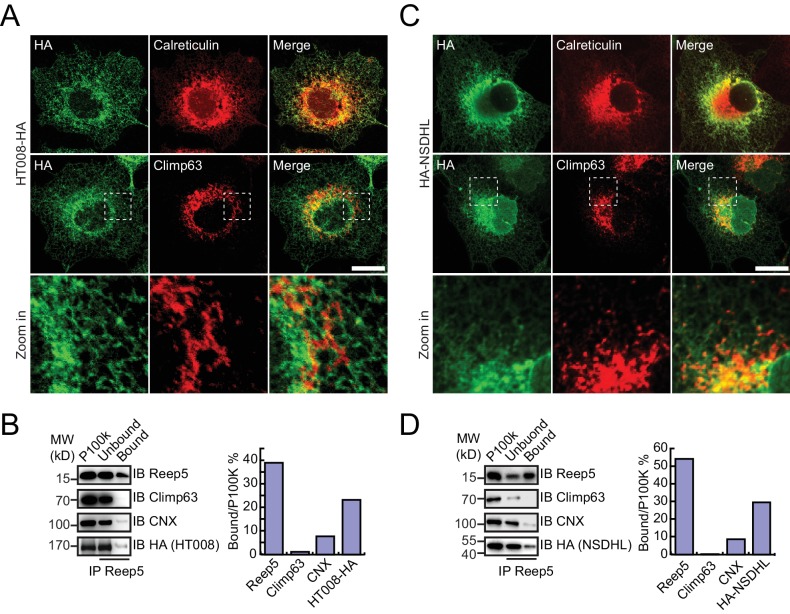
Figure 4. Verification of tubular ER candidates in mammalian cells.

(A) HA-tagged HT008 was transfected into COS-7 cells. Localization was investigated using anti-HA antibodies (green) and compared to total ER protein (calreticulin, red) or ER protein sheets (climp63, red) by indirect immunofluorescence and confocal microscopy. Bottom: enlargements of the boxed regions. Scale bars = 20 μm. (B) HA-tagged HT008 was transfected into HeLa cells. Microsomes were isolated and immunoprecipitation performed with anti-REEP5 antibodies. The samples were analyzed by SDS/PAGE and immunoblotting (left). Quantitative results (right) were obtained based on the Western blot results and analyzed by Image J. The data are representative of at least three repetitions. CNX, calnexin. (C) As in (A), but with HA-NSDHL. (D) As in (B), but with HA-NSDHL.

DOI: http://dx.doi.org/10.7554/eLife.23816.013

Figure 4.

Figure 4—figure supplement 1. Verification of tubular ER candidates.

Figure 4—figure supplement 1.

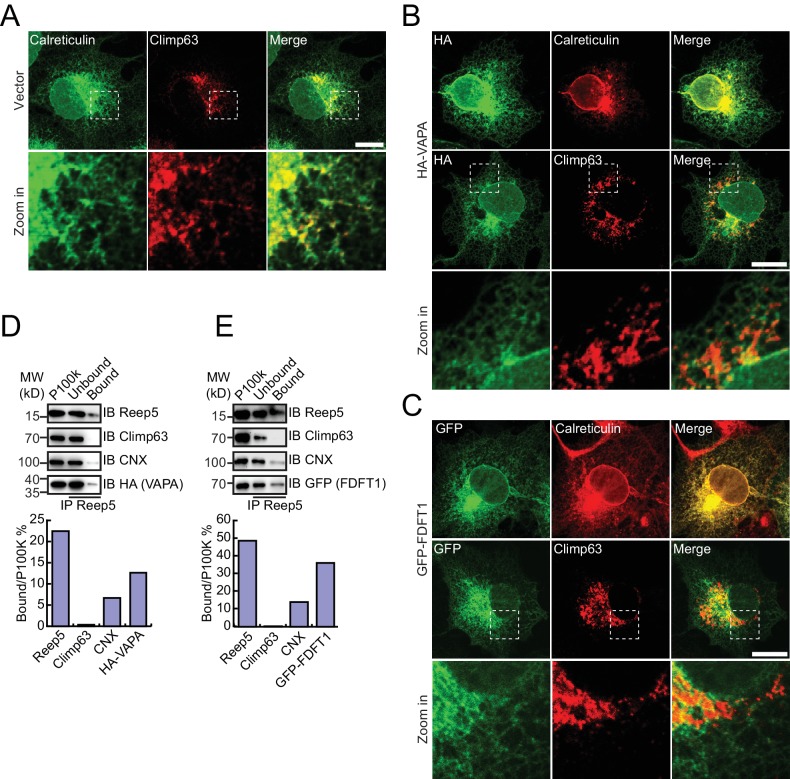
(A) Localization of endogenous total ER protein (calreticulin, green) and ER protein sheets (climp63, red) was determined by indirect immunofluorescence and confocal microscopy. Bottom: enlargements of the boxed regions. (B and C) HA-tagged proteins were expressed in COS-7 cells. Localization was measured using anti-HA antibodies (green) and compared to calreticulin (red) or climp63 (red). Scale bars = 20 μm. (D and E) Immunoprecipitated tubular ER fractions were analyzed by immunoblotting (top) and the signal intensity quantified (bottom). The data are representative of three repetitions. CNX, calnexin.
Figure 4—figure supplement 2. Cytosolic proteins associated with the ER.

Figure 4—figure supplement 2.

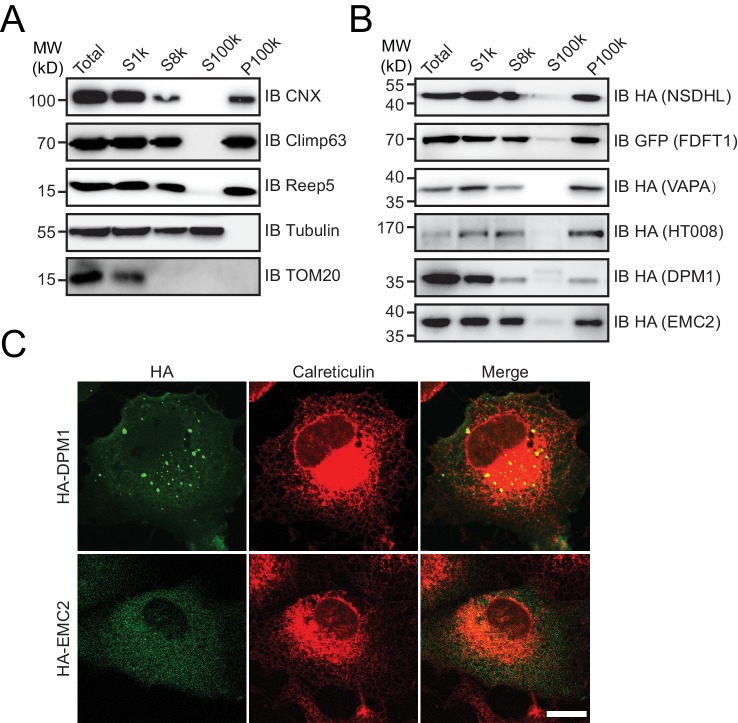
(A and B) Microsome preparation by step centrifugation. Wild-type (A) or candidate-transfected (B) HeLa cells were collected and processed to yield microsomes. The data are representative of at least three repetitions. CNX, calnexin, total ER protein; TOM20, mitochondrial membrane protein; HA or GFP, tested proteins. (C) HA-tagged proteins were expressed in COS-7 cells. Localization was investigated using anti-HA antibodies (green) and compared to total ER protein (calreticulin, red) by indirect immunofluorescence. Scale bars = 20 μm.
Figure 4—figure supplement 3. Verification of endogenous tubular ER candidates using Flp-In cell lines.

Figure 4—figure supplement 3.

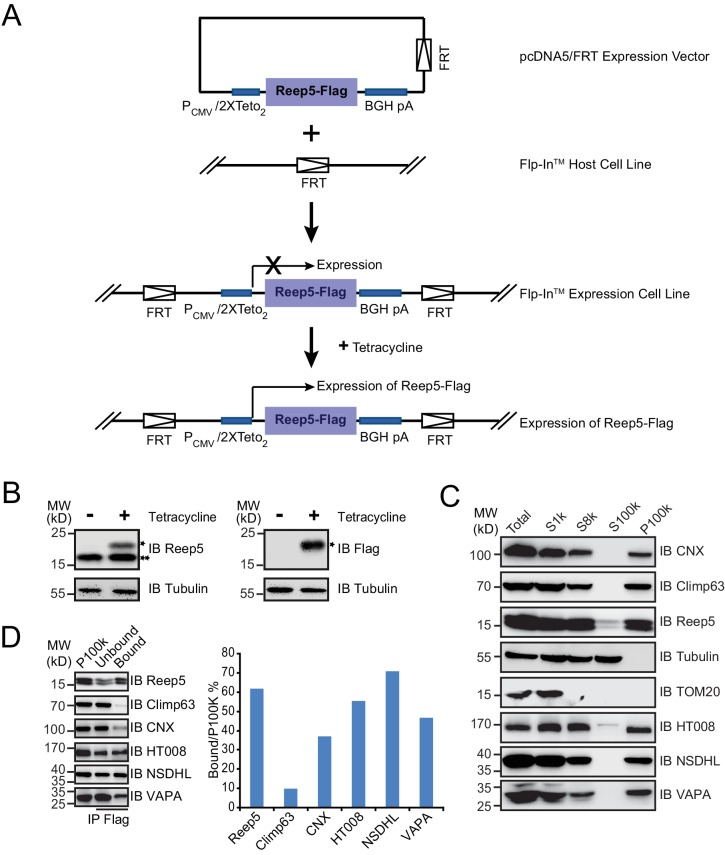
(A) Schematic diagram of the generation of a stable cell line with inducible REEP5-Flag expression. (B) The Flp-In cell line was treated with or without 0.1 µg/mL tetracycline for 24 hr. The expression of total REEP5 or induced REEP5-Flag was verified by immunoblotting (IB) using anti-REEP5 or anti-Flag antibodies. *REEP5-Flag, **endogenous REEP5. (C) Mammalian microsome preparation using cells expressing REEP5 was performed by step centrifugation. Samples from each step were immunoblotted using the indicated antibodies. The data are representative of at least three repetitions. (D) Immunoprecipitated tubular ER fractions were analyzed by immunoblotting (left) and the signal intensity quantified (right). The data are representative of three repetitions.
Figure 4—figure supplement 4. Verification of uncharacterized proteins in mammalian cells.

Figure 4—figure supplement 4.

Uncharacterized yeast proteins were heterogeneously expressed in COS-7 cells and investigated by indirect immunofluorescence. (A) YPR091C, (B) YDL121C, and (C) YMR209C are ER proteins; (D) YNL208W is cytosolic. Calreticulin, total ER protein; TOM20, mitochondrial membrane protein; GM130, Golgi protein. Scale bars = 20 μm.