. 2017 Feb 23;6:e21884. doi: 10.7554/eLife.21884

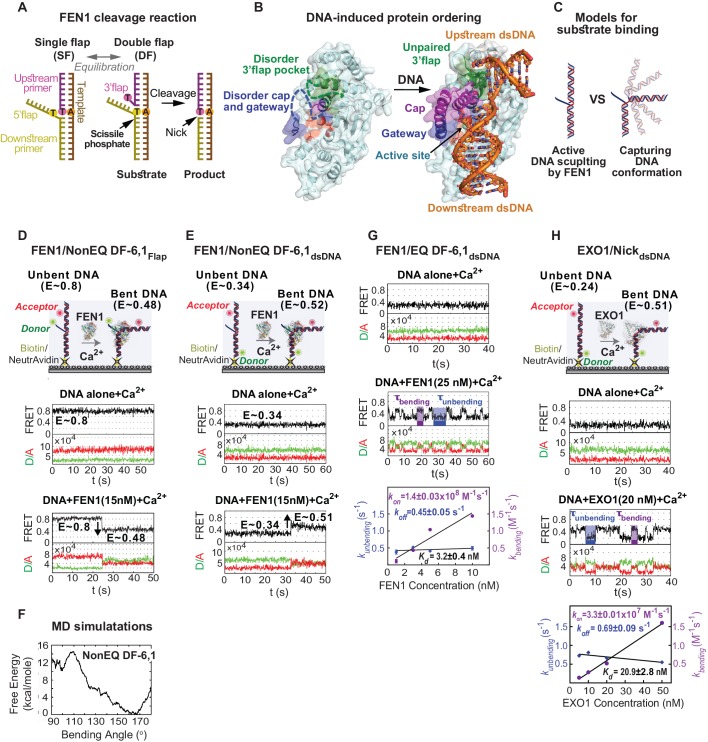
Figure 1. Active junction bending by structure-specific 5’nucleases.

(A) FEN1 cleavage reaction. Schematic showing the equilibration of a flap substrate junction from a single- to a double-flap and its subsequent cleavage by FEN1 to generate a nick that can be sealed by DNA ligase 1. (B) Ordering of FEN1 upon DNA binding. FEN1 alone (1ULI.pdb) (Sakurai et al., 2005) and in complex with bent DNA (3Q8L.pdb) (Tsutakawa et al., 2011), highlighting the various structural features of FEN1 and the regions that undergo through disorder-to-order transitioning upon DNA binding. (C) Active DNA versus DNA conformational capturing models for forming the FEN1 complex with the bent DNA conformer. Monitoring DNA bending of FEN1 and non-equilibrated DF-6,1 using the flap-labeling scheme (NonEQ DF-6,1Flap) (D) and internal labeling-scheme (NonEQ DF-6,1dsDNA) (E). For each labeling, a schematic of the donor and acceptor positions (upper panel) and smFRET time traces of the substrate alone (middle panel) and in presence of FEN1 (lower panel) are shown; change in FRET upon DNA bending in each labeling scheme is highlighted. (F) Analysis of the structure of NonEQ DF-6,1 by MD simulations. The effective free energy profile (PMF) from adaptive biasing force calculations is shown. (G) Bending of equilibrated DF-6,1 (EQ DF-6,1dsDNA) by FEN1. smFRET time traces of EQ DF-6,1dsDNA alone (upper panel) and in the presence of FEN1 (middle panel) and analysis of its DNA bending association rate constant (kon-bending) and dissociation rate constant (koff-unbending) (lower panel) are shown. kbending and kunbending were calculated by fitting an exponential function to the histogram from the population of dwell times of bent (τbending) and unbent (τunbending) conformers, respectively; error bars correspond to the standard deviation of the fit. kon-bending and koff-unbending are calculated from the slope of kbending from a linear regression fit and the mean of kunbending, respectively; the error bars correspond to the standard deviation of the fit. Kd-bending = koff-unbending/kon-bending. (H) Bending of nicked substrate using the internal labeling scheme (NickdsDNA) by EXO1. A schematic of the donor and acceptor positions (upper panel), smFRET time traces of NickdsDNA alone and in the presence of EXO1 (middle panels) and analysis of its kon-bending, koff-unbending and Kd-bending (lower panel) is presented. Donor and acceptor are at identical positions to those in DF-6,1dsDNA in Figure 1E. kon-bending, koff-unbending and Kd-bending were calculated as in 1G. All TIRF-smFRET experiments were acquired at 100 ms.

DOI: http://dx.doi.org/10.7554/eLife.21884.003

Figure 1.

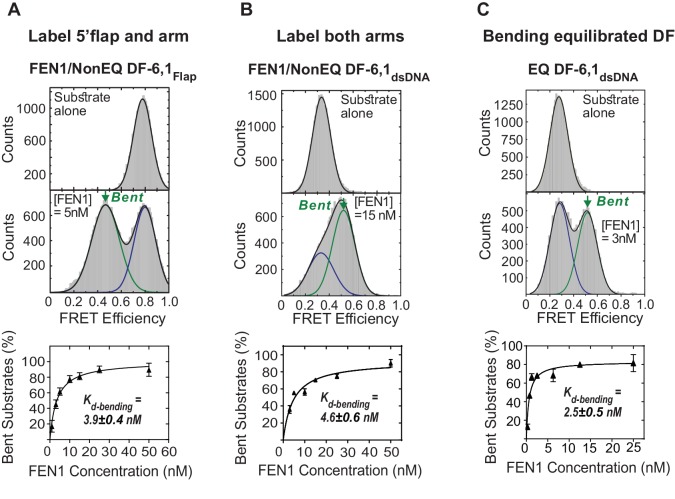
Figure 1—figure supplement 1. Bending of equilibrated and non-equilibrated DF-6,1 by FEN1.

Figure 1—figure supplement 1.

(A) TIRF-based single-molecule FRET (smFRET) of FEN1 and NonEQ DF6,1Flap. Histograms of NonEQ DF6,1Flap alone (high FRET) and in the presence of FEN1 (low FRET) (upper panel). Kd-bending (lower panel) is calculated by fitting the percentage of the bent conformer from the FRET histograms at various concentrations of FEN1 with a non-linear least squares regression; the percentages of unbent and bent DNA are calculated by fitting two Gaussians. The uncertainty in calculating the percentage of bent DNA and Kd-bending correspond to the standard deviation of triplicate measurements and the non-linear least squares regression fit, respectively. (B) Kd-bending of FEN1 on NonEQ DF-6,1dsDNA. Kd-bending is calculated as described in Figure 1—figure supplement 1A. (C) Kd-bending of FEN1 on EQ DF-6,1dsDNA. Kd-bending is calculated as described in Figure 1—figure supplement 1A.

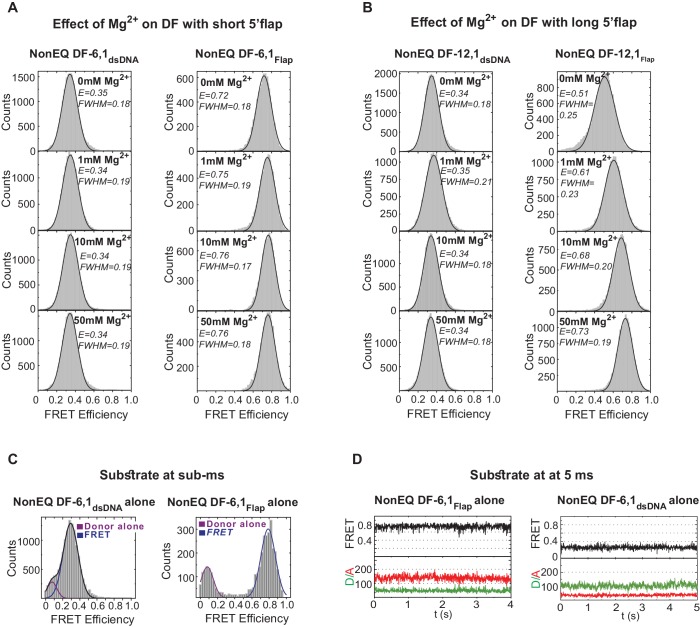
Figure 1—figure supplement 2. Flap substrates exist as a stable extended conformer.

Figure 1—figure supplement 2.

(A) Effect of various Mg2+ concentration on DF-6,1. TIRF-smFRET histograms of NonEQ DF6,1dsDNA (left panel) and NonEQ DF6,1Flap (right panel) with increasing concentration of MgCl2 (0 mM, 1 mM, 10 mM and 50 mM). The insensitivity of both labeling schemes to increasing divalent metal ion concentrations demonstrates that both labeling schemes report directly on the geometry of the duplex DNA. (B) Effect of various Mg2+ concentration on DF-12,1. TIRF-smFRET histograms of NonEQ DF12,1dsDNA (left panel) and NonEQ DF12,1Flap (right panel) with increasing concentration of MgCl2 (0 mM, 1 mM,10 mM and 50 mM). The sensitivity of the flap-labeling scheme to varying divalent metal ion concentrations but not the internal-labeling scheme demonstrates that the geometry of the duplex DNA is not influenced by the length of the 5’flap and that the flap-labeling scheme is inappropriate to describe the geometry of the duplex DNA only when the 5’flap length exceeds 6 nt. All TIRF-smFRET measurements were acquired at 160 ms temporal resolution. FWHM represents the full width at half maximum of the Gaussian peak. (C) Burst confocal-smFRET histograms from freely diffusing DNA in solution of NonEQ DF6,1dsDNA (0.5 nM) (upper panel) and NonEQ DF6,1Flap (0.5 nM) (lower panel) acquired at sub-ms temporal resolution. No enrichment of other FRET conformers was observed upon increasing the temporal resolution from 160 ms (shown in Figure 1—figure supplement 1A,B) to sub-ms. (D) Confocal-smFRET time traces of surface-immobilized NonEQ DF6,1Flap (upper panel) and NonEQ DF6,1dsDNA (lower panel) with 5 ms temporal resolution.

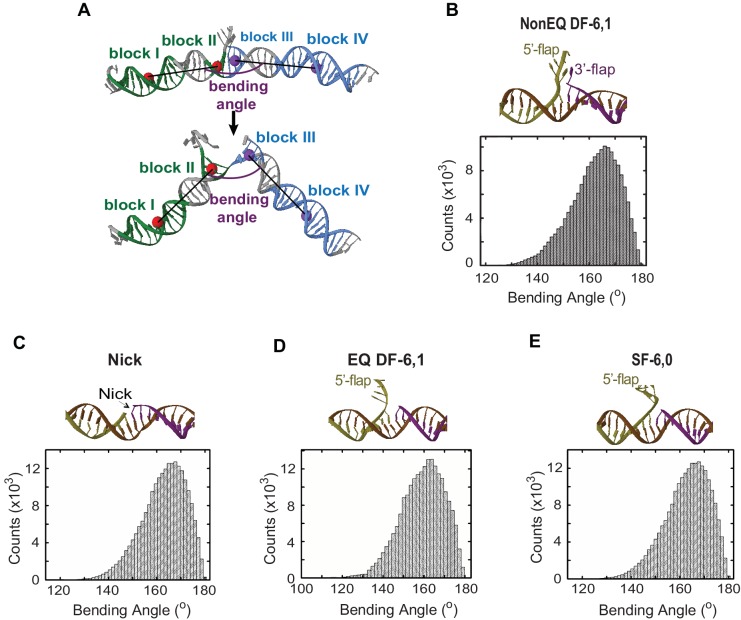
Figure 1—figure supplement 3. MD simulations of the conformational states and DNA bending energy of nick and various flap structures.

Figure 1—figure supplement 3.

(A) Definition of the DNA bending angle. The bending angle is calculated between two vectors. One vector was defined by using the center of the masses of two blocks of nucleotides: block I (green) and block II (green) and one vector was defined with the center of mass of block III (blue) and block VI (blue). (B, C, D and E) are the averaged structure (upper panel) and histogram of the DNA bending angle (lower panel) for NonEQ DF-6,1, Nick, EQ DF-6,1 and SF-6,0, respectively, taken from the MD simulations. These MD simulations demonstrated that the extended DNA structure was the most energetically favorable conformer in all tested substrates and that these substrates could sample bent conformers up to 140°, which are equivalent to those observed for dsDNA (Sharma et al., 2013).

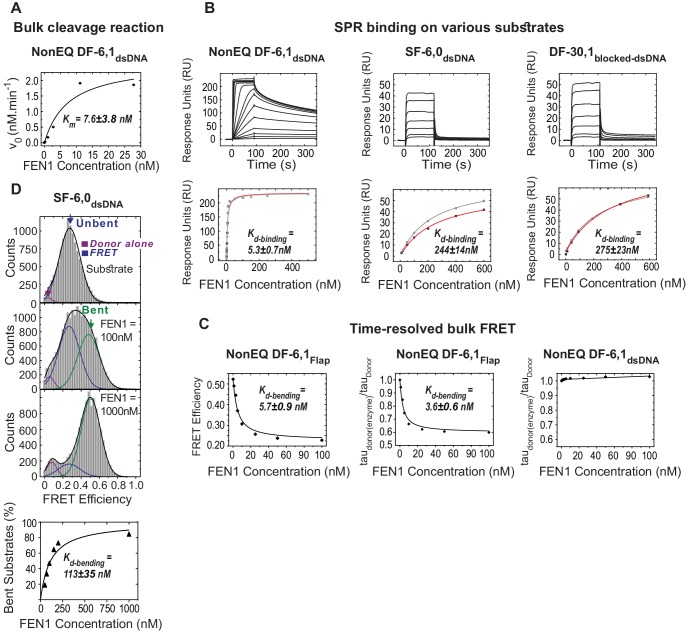
Figure 1—figure supplement 4. Bulk cleavage, SPR binding and time-resolved bulk FRET of selected substrates.

Figure 1—figure supplement 4.

(A) Cleavage of NonEQ DF-6,1dsDNA (0.5 nM) by bulk assays. A plot of initial rates (v0, nM.min−1) in relation to the FEN1 concentration fitted with a generalized non-linear least-squares regression using a Michaelis-Menten model. The values for v0 were estimated using bulk cleavage assays with different time intervals as described in the Materials and methods. This plot was used to determine the steady-state Km. Uncertainty in Km corresponds to the standard error of the fit. (B) SPR binding studies of FEN1 and NonEQ DF-6,1dsDNA (left panel), SF-6,0dsDNA (middle panel) and DF-30,1blocked-dsDNA (right panel). The sensorgram of binding of increasing concentrations of FEN1 is shown (left panel). The maximum response units (RU) reached at each FEN1 concentration were fitted using the steady-state affinity model to obtain the equilibrium dissociation binding constant (Kd-binding) (lower panel). The uncertainty corresponds to the standard deviation of N = 2 runs. 170 RU, 70 RU and 90 RU of NonEQ DF-6,1dsDNA, SF-6,0dsDNA and DF-30,1blocked-dsDNA were immobilized on the surface, respectively. (C) Bulk-FRET measurements of NonEQ DF-6,1. The FRET efficiency of the donor-acceptor pair in NonEQ DF-6,1Flap at different FEN1 concentrations (left panel) and relative fluorescence lifetimes (taudonor(enzyme)/taudonor) at different FEN1 concentrations without acceptors (middle panel) are shown. The results show that FEN1 binding influenced the fluorescence intensity of the donor in the flap-labeling scheme. Kd-bending after correcting for the effect of the donor was similar to that obtained from uncorrected apparent FRET (Figure 1—figure supplement 1C); Kd-bending was calculated using a standard quadratic equation for the simple bimolecular association as described in Materials and methods and the uncertainty corresponds to the standard error of the fit. The uncertainty corresponds to the standard error of the fit. Bulk-FRET measurements of NonEQ DF-6,1dsDNA (right panel). The relative fluorescence lifetime (taudonor(enzyme)/taudonor) OF DF-6,1dsDNA at different FEN1 concentrations without acceptors (right panel), showing no effect on the donor fluorescence intensity upon FEN1 binding in the internal-labeling scheme. (D) Burst confocal-smFRET histograms from freely diffusing substrate missing the 3’flap but containing the 5’flap (SF6,0dsDNA) (0.5 nM) in solution acquired at sub-ms temporal resolution (upper panel). Kd-bending (lower panel) calculated as described in Figure 1—figure supplement 1A.

Figure 1—figure supplement 5. Active bending of nicked DNA by EXO1.
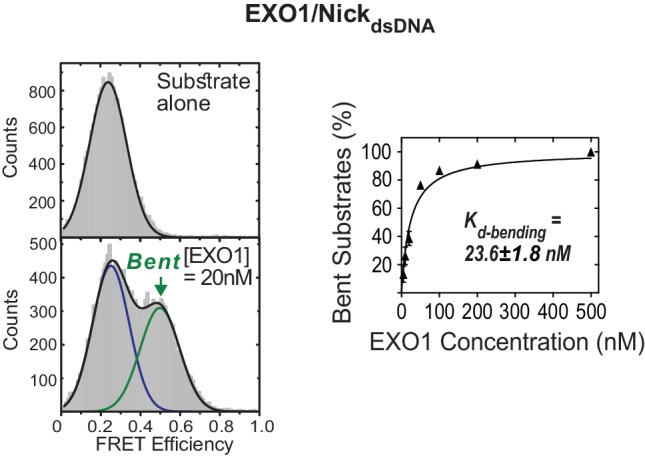
Figure 1—figure supplement 5.

TIRF-smFRET histograms of NickdsDNA alone and in the presence of EXO1 (left panel) and Kd-bending (right panel). Kd-bending is calculated as described in Figure 1—figure supplement 1A. The donor and acceptor in NickdsDNA are at identical positions to those in NonEQ DF6,1dsDNA.