. 2017 Feb 22;6:e22341. doi: 10.7554/eLife.22341

Figure 4. IPS is the source of top-down modulation to VTC.

(aCorrelation with raw VTC response. This map depicts the correlation between the VTC response observed during the categorization and one-back tasks with the response at each cortical location (inset shows an unsmoothed and unthresholded map). Positive correlations are broadly distributed across occipital cortex. Results are shown for subjects with whole-brain coverage (n = 3); results for other subjects with partial-brain coverage (n = 6) are shown in Figure 4—figure supplement 1. (b) Correlation with top-down component of VTC response. After removing bottom-up responses (fixation task), the correlation is spatially localized to a hotspot in IPS-0/1. (c) Tractography using diffusion MRI. We find that the vertical occipital fasciculus (Yeatman et al., 2014) connects VWFA and FFA to the IPS hotspot in each subject for which diffusion data were collected (n = 8) (rendering shows a representative subject).

DOI: http://dx.doi.org/10.7554/eLife.22341.008

Figure 4.

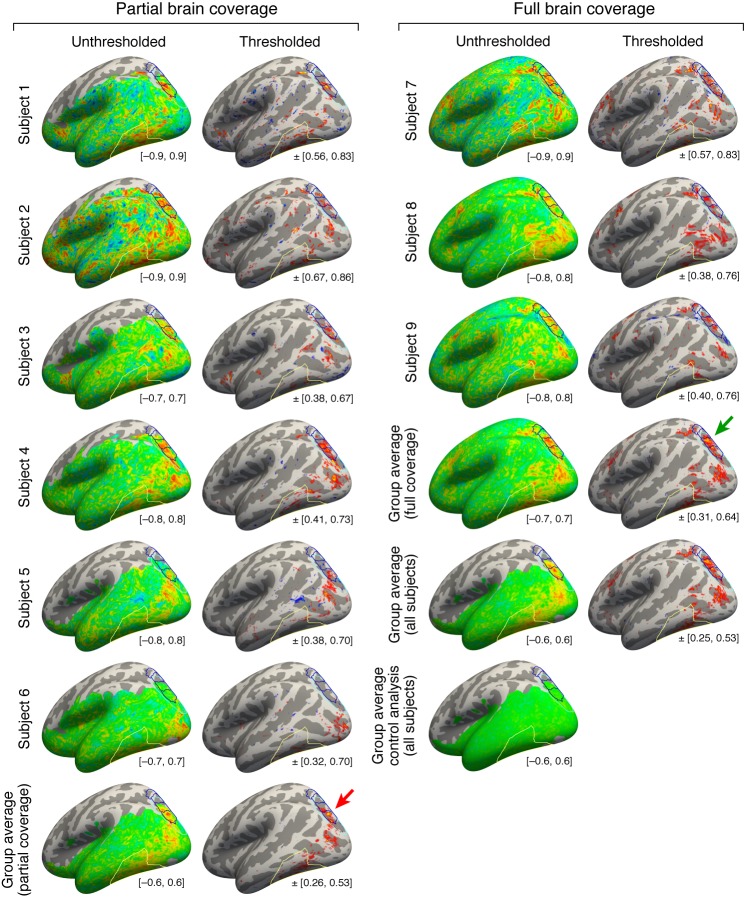
Figure 4—figure supplement 1. Maps of top-down connectivity to VTC.

Figure 4—figure supplement 1.

This figure shows thresholded and unthresholded maps for individual subjects and group averages (same format as Figure 4b; all maps shown on the fsaverage surface). At the lower right of each map is the range of values used for the colormap. The left two columns show the results obtained for the six subjects with partial brain coverage. Group average results for these subjects are shown in the last row. The right two columns show the results obtained for the three subjects with full brain coverage. Group average results for these subjects are shown in the third to last row. Group average results for all subjects are shown in the second to last row. The last row shows the results obtained from a control analysis in which we generate individual-subject maps by correlating cortical responses with random Gaussian noise and then average these maps across subjects. This control analysis produces no substantial correlations. Notice that the peak correlation is found in and around IPS-0/1 for both the group of subjects with partial brain coverage (red arrow) and the group of subjects with full brain coverage (green arrow). Some variability in the location of the peak correlation is expected given that there are limits on the degree to which functional areas can be aligned across subjects based solely on anatomical features.