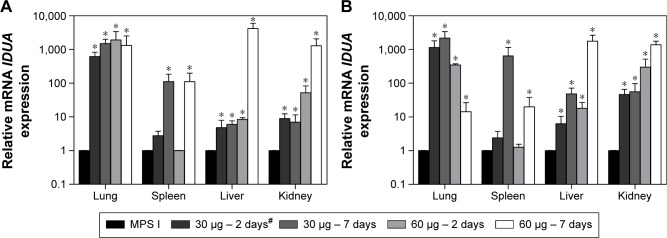
Figure 1.
Relative expression of IDUA by real-time RT-qPCR in different organs of MPS I mice treated with NEP/pIDUAA (A) and NEP/pIDUAE (B).
Notes: Mice were treated with 30 μg of pIDUA (dark gray bars) or 60 μg of pIDUA (light gray bars) and euthanized 2 days after intravenous injection or 30 μg of pIDUA (medium gray bars) or 60 μg of pIDUA (white bars) and euthanized 7 days after intravenous injection. Nontreated MPS I mice were used as control (black bars). Expression ratios are relative to GAPDH endogenous control. Values represent the mean ± standard error of the mean and are presented in log scale. *Difference between treated and nontreated MPS I mice (Student’s t-test, P<0.05). #Data from Fraga et al.7
Abbreviations: MPS I, mucopolysaccharidosis type I; RT-qPCR, quantitative real-time polymerase chain reaction.

