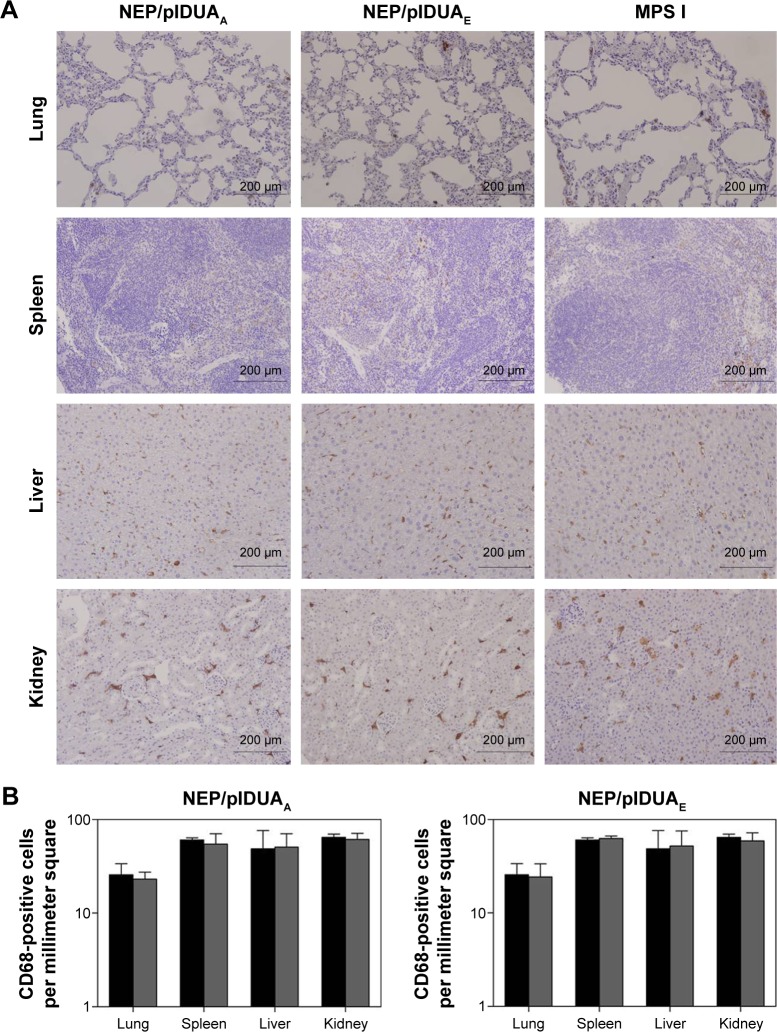
Figure 3.
CD68 immunohistochemistry.
Notes: (A) Representative sections of different organs of treated groups (NEP/pIDUAA and NEP/pIDUAE) and negative control (MPS I). Magnification ×200. (B) Quantification of CD68-positive cells per millimeter square of tissue. Treated mice are in dark gray bars, and nontreated MPS I mice are in black bars. Values represent the mean ± standard error of the mean.
Abbreviations: MPS I, mucopolysaccharidosis type I; NEP, PEGylated nanoemulsion.

