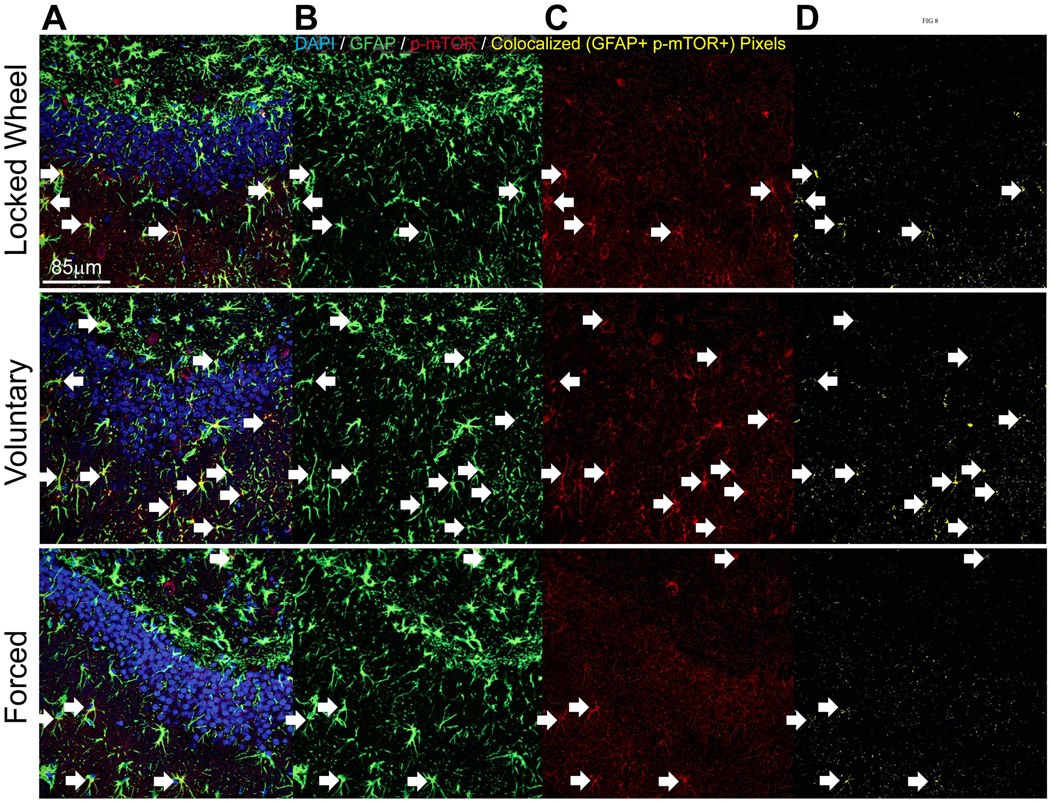
Figure 8.
Representative confocal images of GFAP (green) / p-mTOR (red) double immunofluorescence in the dentate gyrus of sedentary (top), voluntary run (middle) and forced run (bottom) groups. Bar A: Overlay. Bar B: CD11 only. Bar C: p-mTOR only. Bar D: co-localized pixels only. White arrows indicate cells that were counted as double labels.

