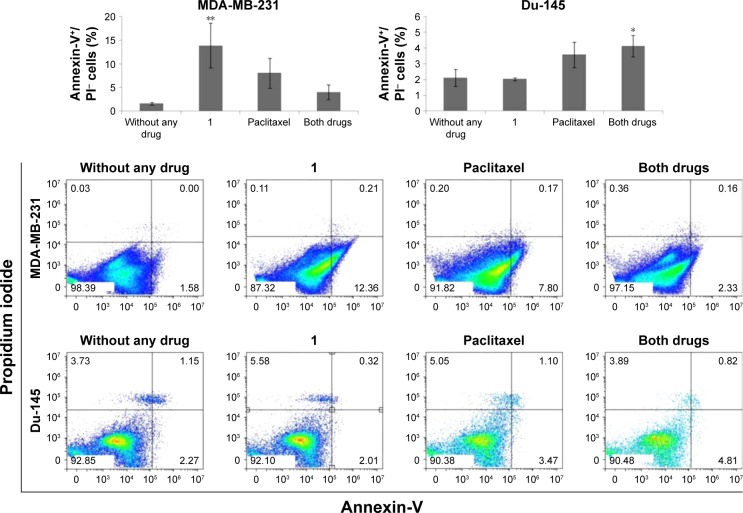
Figure 3.
Apoptosis after drug treatment.
Notes: Apoptosis after treatment with 2 μM compound 1 combined with 40 or 12 nM paclitaxel, in duration of 48 h in MDA-MB-231 or Du-145 cell lines, respectively. Data represent the mean ± SD of AnnexinV+/PI− cells. Columns, mean of cells; bars, SD; *P<0.05 and **P<0.01.
Abbreviation: SD, standard deviation.

