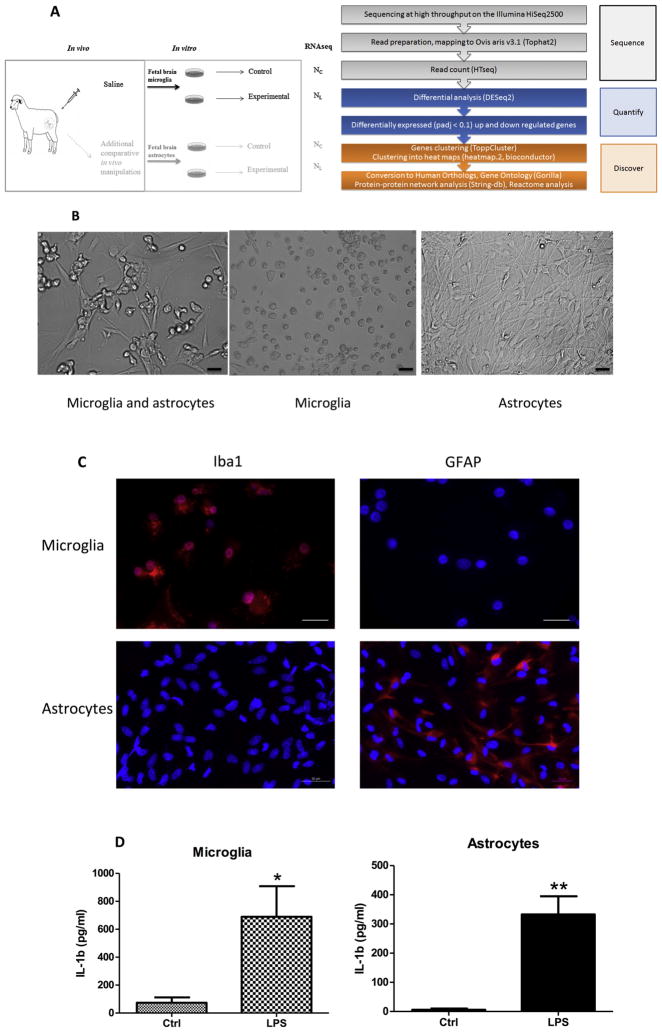
Fig. 1.
(a) In vivo–in vitro experimental design (LEFT) and RNAseq pipeline (RIGHT). In vivo, Control (saline) group is shown; in vitro, cultured cells are derived from the in vivo Control animal, named as Naïve; this simplified design renders two experimental groups: naïve Control (NC) and naïve LPS-exposed (NL). For RNAseq data comparisons, we performed differential expression analysis of NC (n = 3) and NL (n = 3). Cf. (Cao et al., 2015) where a more sophisticated experimental design is presented. (b) Cell collection and purification. Heterogeneous cells were obtained from twin fetal sheep brains and cultured in PLL-coated T75 tissue culture flask at a concentration of 2× 10⁶ cells/ml in DMEM with 5% heat-inactivated fetal bovine serum (FBS) for 1 week; the majority of this cell population were microglia and astrocytes (Left panel). Floating microglial cells were then collected by centrifugation and seeded into 24-well plate at 1 × 10⁵ cells/ml with 5% DMEM for another 7 days for treatment (middle panel). The adherent astrocytes were passaged 4–5 times once a week for further purification; those astrocytes were cultured in new T75 flasks every passage at a concentration of 1–2 × 10⁶ cells/ml in DMEM with 10% FBS; the pure astrocytes were plated into 24-well tissue culture plate at 1 × 10⁵ cells/ml with 10% DMEM for another 7 days for treatment (Right panel). Note cell morphological difference between round microglia (middle) versus elongated astrocytes (right). Images were taken with an inverted light microscope, magnification 20× for all 3 images, scale bar = 50 μm. (c) Purity validation of fetal sheep brain primary microglia and astrocytes cultures. Photomicrographs (ICC) confirming cell purity. Iba1+ staining in microglia vs. undetectable GFAP signal in microglia indicating no contamination with astrocytes in the culture (upper panel). The reverse is seen for the primary astrocyte cultures (lower panel). Scale bar = 50 μm. Magnification 40× for all images. (d) Effect of in vitro LPS treatment on microglial and astrocyte IL-1β production in conditioned media indicating cells were responding adequately to the LPS stimulus. Cultured cells were derived from in vivo Control or twin (Naïve), cell culture condition and IL-1b ELISA assay as described in the text. Results are expressed as mean ± SEM (n = 6 for microglia, n = 3 for astrocyte); data were analyzed by t-test (*P < 0.05, ** P < 0.01 compared with Control group).

