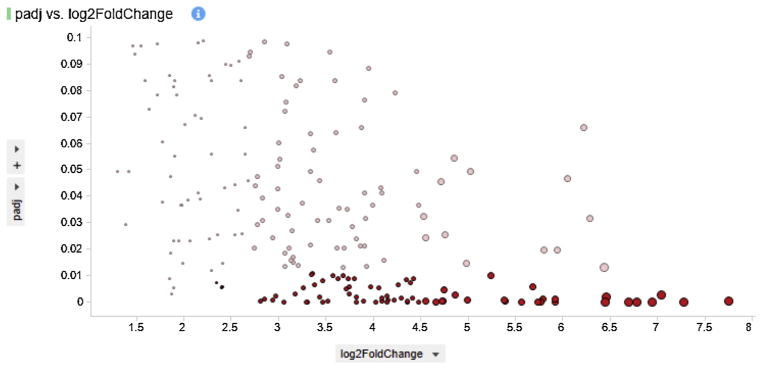
Fig. 2.
Visualization of dataset size variation with threshold variation of Log2 fold change and adjacent p-value. The analysis of 205 differentially expressed (padj < 0.1) up regulated genes can be narrowed down by two-fold selection and higher FDR value (pad < 0.01), as shown here with significant genes highlighted in red.

