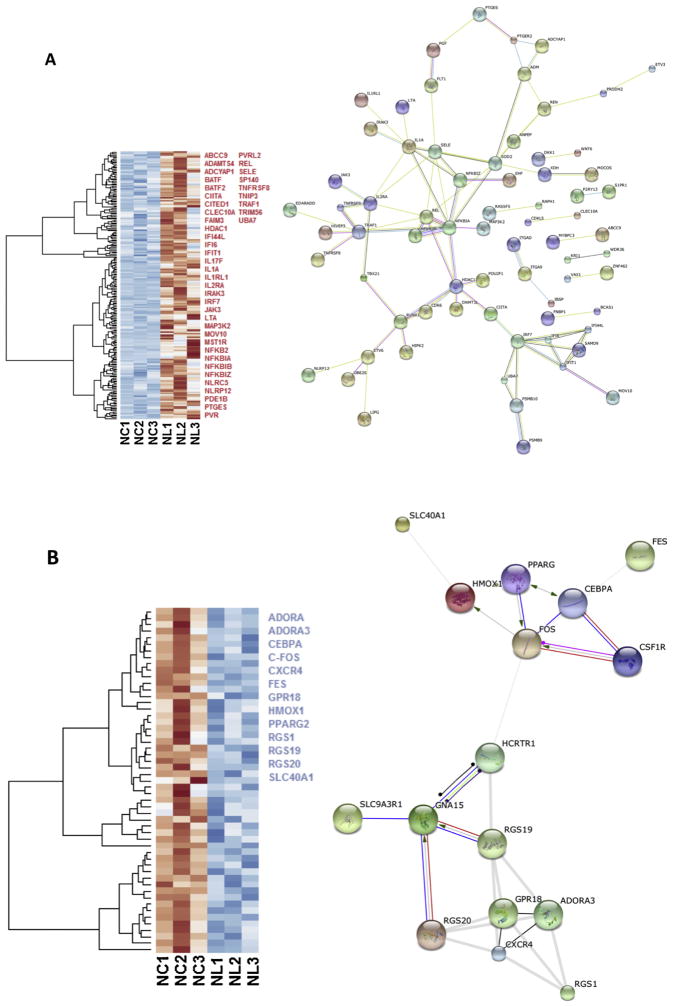
Fig. 3.
Heat maps of the gene expression in microglia cells exposed to LPS. Selected up regulated (red) and down regulated (blue) genes are listed; genes were selected with ToppCluster based on their significance in the immune response (logP > 4.00) (a) Heat map of 205 differentially expressed (padj < 0.1) up regulated genes (red) in NL microglia. Interaction network highlights the position of NFKB and JAK3 genes. Protein-protein interaction networks were built with the STRING database on human orthologs and disconnected nodes were not representend. (b) Heat map of 53 differentially expressed down regulated genes in NL microglia, among selected genes indicated in blue, HMOX1 was strongly differentially expressed (Log2 = −2.686 and padj = 3.09 × 10⁻⁸). In both up and down regulated genes, we observed a different behavior for NL3 that did not affect our differential analysis. On the right, interaction network shows how HMOX1 and FOS are connected. NC = Naïve control microglia, NL = Naïve LPS-exposed microglia (Cao et al., 2015). (For interpretation of the references to colour in this figure legend, the reader is referred to the web version of this article.)

