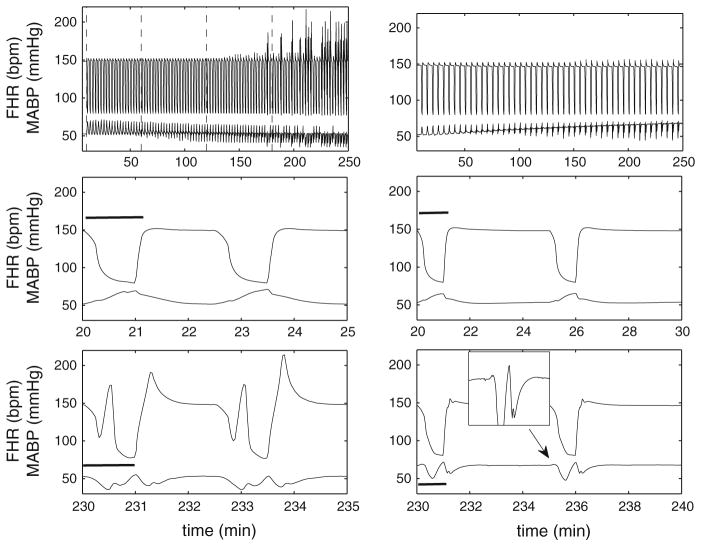
Fig. 4.
Numerical results of FHR and MABP for 1:2.5 and 1:5 UCO. Numerical results for 4 h of occlusions with 1:2.5 UCO (left) and 1:5 UCO (right). Gc = 0.27 and Gva = −0.67 are used in simulation with 1:5 UCO. The dashed lines in the upper left panel divide the time periods into four one-hour windows. The first dashed line marks the beginning of the occlusions. The middle row displays a zoom of 5- (left) and 10-min (right) windows for each case at the beginning of the occlusion, and the bottom row 5- (left) and 10-min (right) windows near the end of occlusions. The black bar indicates the occlusion duration. The inset of the right bottom panel shows that MABP rises slightly at the beginning of each occlusion and then declines

