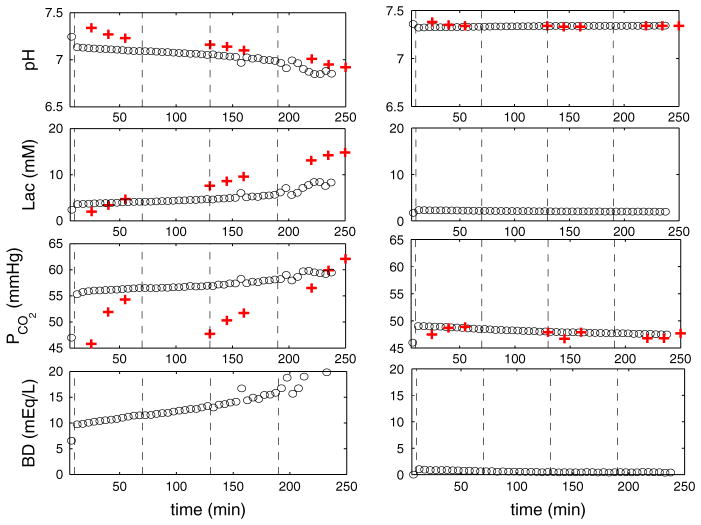
Fig. 6.
(Color figure online) Numerical results of pH, lactate, PCO2 and BD for 1:2.5 and 1:5 UCO. Time variations of pH, lactate, PCO2 in the systemic compartment and BD for 1:2.5 UCOs (left) and 1:5 UCO (right). The circle symbol represents the mean values over 5 min after occlusion begins. The plus symbol represents experimental data (Table 1 in Bennet et al. 2005)

