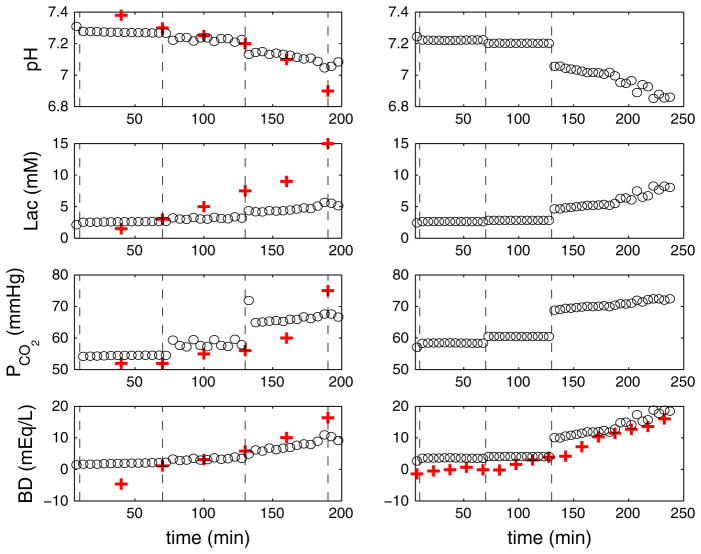
Fig. 7.
(Color online) Numerical results of pH, lactate, PCO2 and BD for variable UCOs. Time variations of pH, lactate, PCO2 and BD in the systemic compartment for complete UCO with varying frequency (left column 1:5 UCO for the first, 1:3 for second and 1:2 for the third and fourth hours) and UCO of varying degree with constant frequency (right column mild occlusion during the first, moderate during the second and severe during the third and fourth hours). In the simulations displayed by the left column, K7 = 35 × 10−6 s−1 in Eq. 31 and K6 = 5 s−1 are chosen to match with the experimental pH variation; kCO2 = 0.008 in Eq. 23 is chosen to match the baseline value of PCO2 = 52.7 ± 0.9 mmHg in the experiments (Frasch et al. 2009b). The remaining parameters are given in Tables 1, 2 and 3

