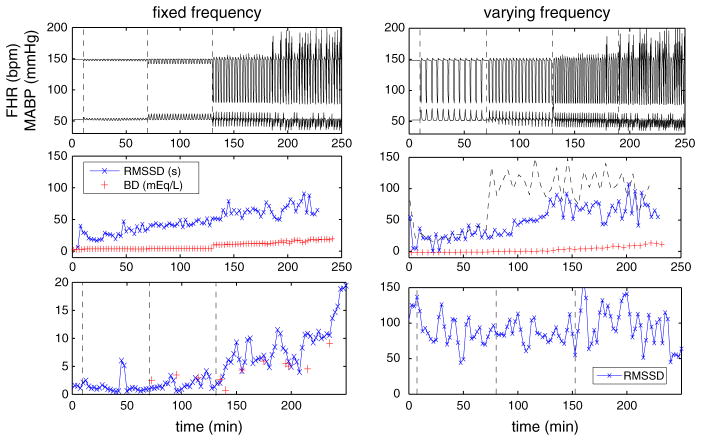
Fig. 8.
(Color figure online) Computed RMSSD with a sampling frequency of 4 Hz and BD for UCOs with varying occlusion degrees (left) and varying frequencies (right). Patterns of FHR (top), RMSSD and BD (middle), and the corresponding representative experimental results (Gold et al. 2015; Wang et al. 2014) (bottom). In the middle row, RMSSD is computed using 5-min windows for the left column. For the right column, RMSSD is computed using both 3- (cross-symbol) and 5-min (dashed line) windows

