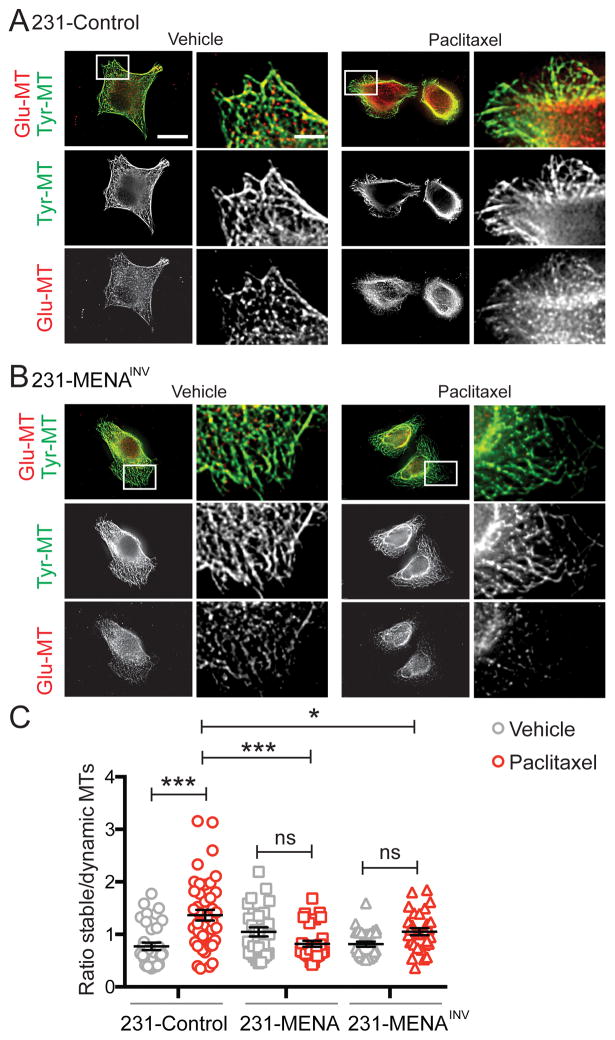
Figure 5. MENA expression alters MT dynamics during paclitaxel treatment.
Representative images of 231-Control (A) and 231-MENAINV (B) cells treated with paclitaxel (10nM) for 24h, and immunostained for detyrosinated or Glu-Tubulin (red) and tyrosinated or Tyr-Tubulin (green). Scale bar is 1 μm, and 0.25 μm in inset. (C) Quantification of the ratio of Glu-MT relative to Tyr-MT in 231-Control, MENA or MENAINV cells treated with vehicle (0.01% DMSO) or 10nM paclitaxel for 24h. Data presented as mean± SEM. Data pooled from 3 separate experiments, at least 8 cells analyzed per experiment. Statistics determined by one-way ANOVA, where *** p<0.001, ** p<0.01, * p<0.05.

