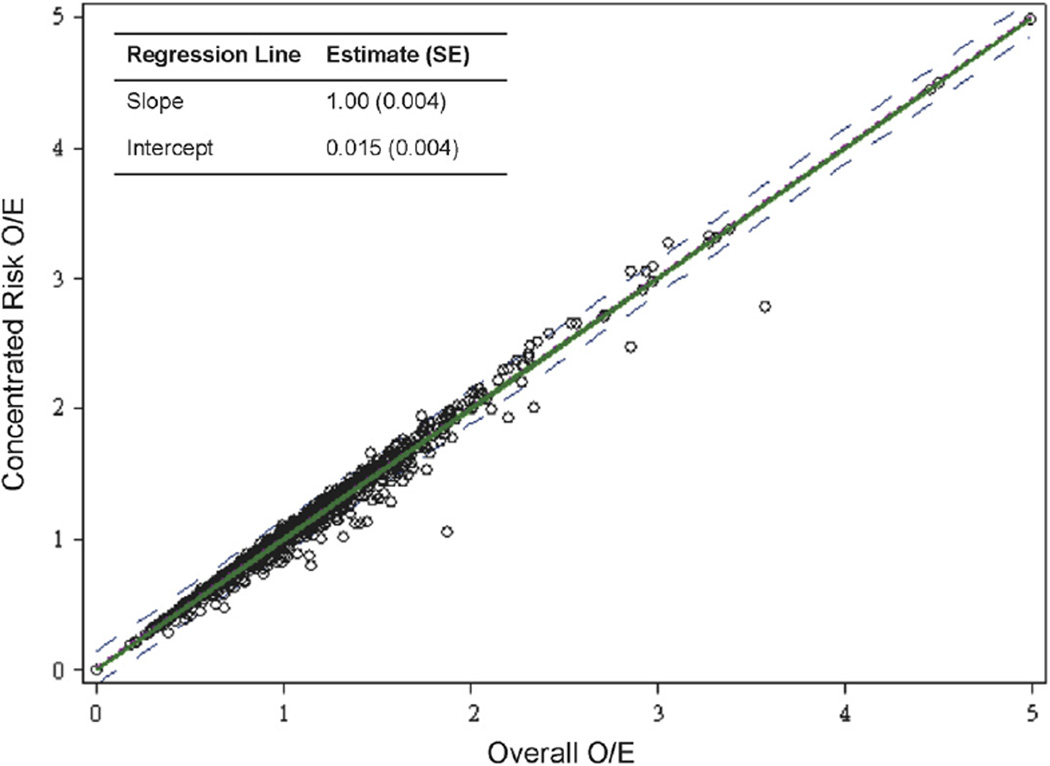
FIGURE 3. Observed/Expected Mortality by Hospital Risk Quintile in a “Concentrated Risk Year” Versus an Average Year.
Observed versus expected mortality (O/E) ratios when the highest-risk cases or concentrated into a single year compared with overall O/E ratio in an average year show there is still a 1:1 relationship at all levels of risk. The 95% confidence intervals are shown with dotted lines, and a regression line fit to the hospital data shows consistent agreement between concentrated risk year and average year performance.

