


Figure II.
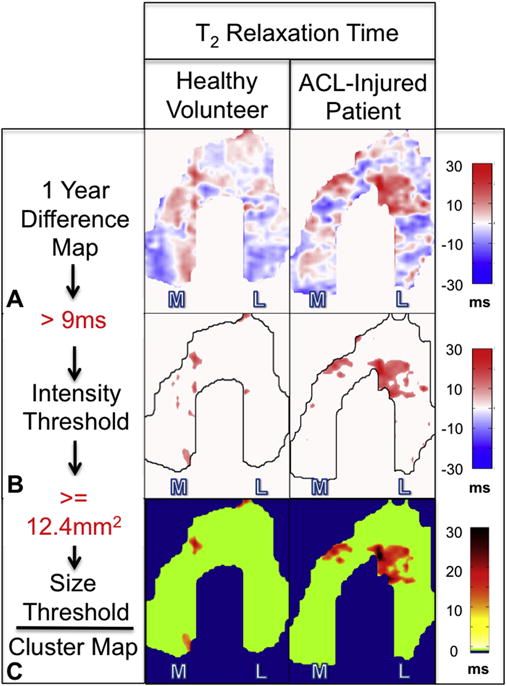
Cluster map pipeline showing the difference maps (A) used with the determined intensity (B) and area (C) thresholds to create the final cluster map.
Official websites use .gov
A
.gov website belongs to an official
government organization in the United States.
Secure .gov websites use HTTPS
A lock (
) or https:// means you've safely
connected to the .gov website. Share sensitive
information only on official, secure websites.
Cluster map pipeline showing the difference maps (A) used with the determined intensity (B) and area (C) thresholds to create the final cluster map.