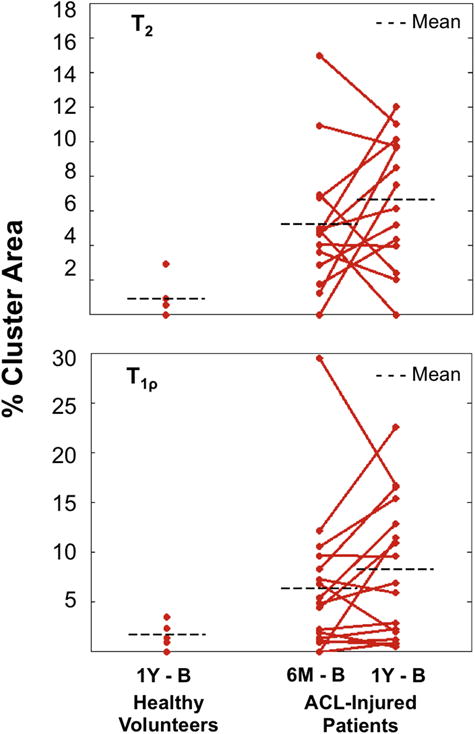
Figure III.

% Cluster Areas of projection maps covered by clusters in the ACL-injured population for both T2 and T1ρ as compared to the healthy volunteers. A T2 elevation threshold of +9ms and a T1ρ elevation threshold of +10.8ms was applied at 6 months and 1 year with individual %CA’s shown in 14 (T2) and 17 (T1ρ) ACL-injured patients and averaged %CA’s shown in both populations.
