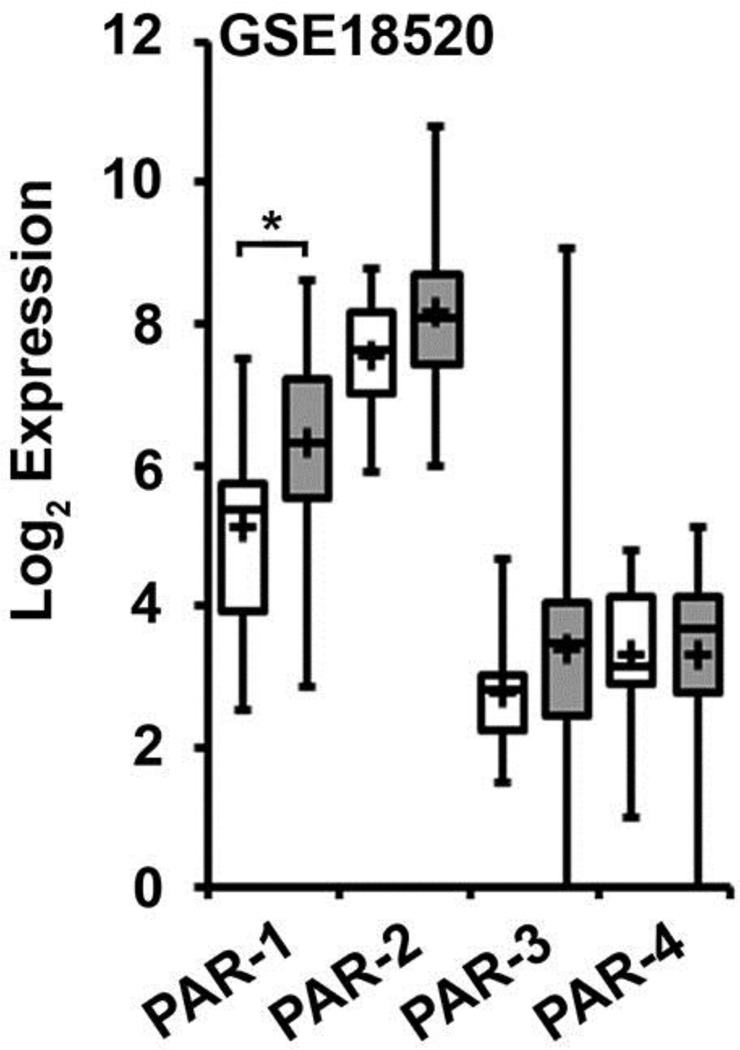
Figure 1. Gene array analysis of PAR expression in ovarian cancer and human ovarian surface epithelial tissue.
Gene expression data for PAR-1–4 was downloaded from the dataset Mixed Ovarian-Birrer-63-MAS5.0-u133p2[GSE18520], which contains a panel of 53 ovarian cancer tissue and 10 normal ovarian tissue samples evaluated by expression micro-array analysis. All analyses were performed using R2 Genomics Analysis and Visualization Platform, an Affymetrix analysis and visualization platform developed at the Academic Medical Center Amsterdam, the Netherlands. Transcript expression levels were obtained from Mas5.0 analysis and derived from the R2 dataset. The Affymetrix probe-sets were selected using the R2 bio-informatic platform. The unpaired, heteroscedastic Student’s t-test was used to determine significant differences. Shown are the absolute expression levels on a log2 scale. PAR-1–4 expression in normal ovarian tissue (white bars) and ovarian cancer tissue (gray bars) were compared by student’s t-test (* p<0.05).

