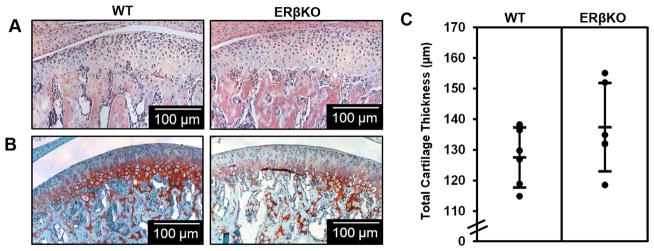
Figure 1. ERβ mandibular condylar cartilage phenotype in male mice.
Representative hematoxylin & eosin (H&E) images (A), Safranin-O images (B), and histomorphometric cartilage thicknesses (C) for 49–day WT and ERβKO male mice treated with placebo and subjected to normal load. For histomorphometric analysis, n=6 mice were utilized from each group and the average of 3–6 sections/mouse was analyzed. Statistical significance was determined by a Student’s t-test and p = 0.18.

