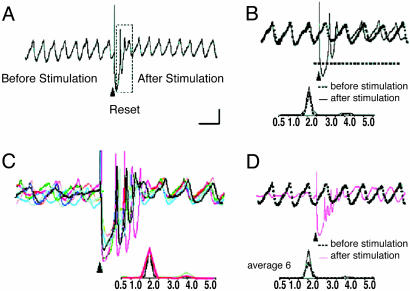
Fig. 1.
Intracellular inferior olive oscillations recorded in vitro. (A) Spontaneous oscillations are interrupted by an extracellular stimulus (arrowhead), delivered to the dorsal border of the IO nucleus. After stimulation, the oscillations were interrupted for 750 ms (boxed area) before resuming. (B) Superposition of recordings of spontaneous (dashed line) and stimulus-evoked (solid line) oscillations from the same cell. Note that extracellular stimulation modified only the phase of spontaneous oscillations without affecting their amplitude or frequency. (C) Superposition of six (color-coded) individual intracellular traces of stimulus-evoked oscillations from the same cell are superimposed on the left. Note that the frequency of all of the stimulation-evoked oscillations is 2.0 Hz, and the stimulation-induced shift in the oscillatory phase is similar. Oscillations are clearly seen after the stimulus induced reset but can be barely detected before the stimulation. (D) Superposition of mean stimulus-evoked oscillations (n = 6, red line) and spontaneous oscillations (dashed black line). Note that the average trace has the same frequency and amplitude as the spontaneous oscillations and differs only in the phase shift. [Calibration bar: 1 mV; 1s (A), 500 ms (B and D), and 415 ms (C).] (Modified from ref. 9.)

