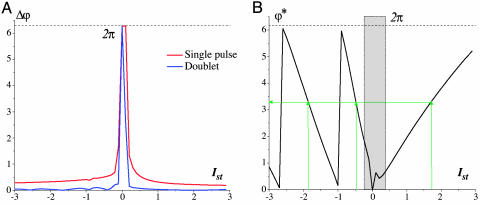
Fig. 4.
Characteristics of the SPR effect. (A) Deviation of the reset phase (red curve) depending on the stimulus amplitude for fixed stimulus duration τst = 0.4T, T = 51.1. The deviation Δϕ is defined as the difference between the maximum and minimum reset phase values. The blue curve corresponds to the doublet stimulation for interpulse interval 12T. n = 100 initial phases have been uniformly distributed in the interval [0, 2π]. (B) Stimulus amplitude – reset phase dependence for fixed stimulus duration τst = 0.4T, T = 51.1. The reset phase ϕ* is computed as the mathematical average from n = 100 oscillation traces. The green arrows show how the desired value of the reset phase can be obtained by the appropriate choice of stimulus amplitude for excitatory, Ist > 0, and inhibitory, Ist < 0, stimulation.

