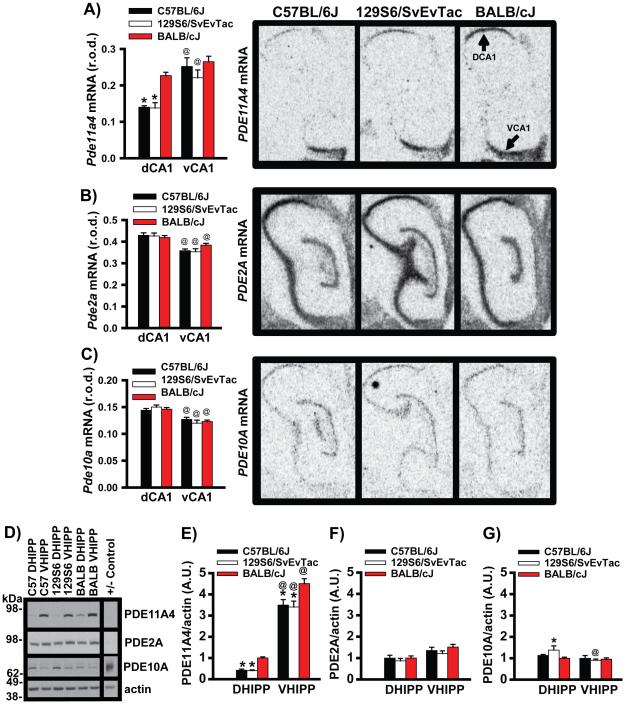
Figure 1. C57BL/6J mice express significantly lower levels of PDE11A4 mRNA than do BALB/cJ mice.
To determine if lithium responsiveness may correlate with PDE11A expression across mouse strains, we measured PDE11A4 expression in hippocampi taken from mice that respond well (C57BL/6J), moderately well (129S6/SvEvTac), or poorly to chronic lithium (BALB/cJ). A) PDE11A4 mRNA expression in the C57BL/6J (n=7) and 129S6/SvEvTac mice (n=7) is significantly lower than that in the BALB/cJ mice (n=6); however, this difference in mRNA expression is restricted to dorsal CA1 (DCA1). Data is shown for the oligonucleotide probe that selectively recognizes the PDE11A4 isoform, but is representative of results obtained with 3 different oligonucleotide probes (see Figure S1 for data collected in a second cohort). Surprisingly, BALB/cJ mice fail to show the typical enrichment of PDE11A4 mRNA expression in ventral CA1 (VCA1) vs. DCA1, as has been previously reported in mice and rats and can be seen here in the C57BL/6J mice and 129S6/SvEvTac mice. B) The expression of PDE2A and C) PDE10A mRNA are not significantly different between strains, suggesting specificity of the PDE11A4 effect. D) Western blots measuring PDE11A4 (−control = PDE11A KO VHIPP), PDE2A (− control = cerebellum), PDE10A (+ control = striatum), and actin. E) C57BL/6J and 129S6/SvEvTac mice express significantly less PDE11A4 protein relative to BALB/cJ mice in both DHIPP and VHIPP (n=12/strain). Further, all 3 strains demonstrate far more expression of PDE11A4 protein in VHIPP vs. DHIPP, despite the lack of difference at the mRNA level in the BALB/cJ mice. These effects were replicated in a second cohort of mice (Figure S2). F) Neither PDE2A nor G) PDE10A protein expression differ between the strains, again suggesting specificity of the PDE11A4 effect. Post hoc, * vs BALB/cJ, P<0.001; @vs DCA1 or DHIPP , P<0.017-0.001. R.O.D.—relative optical density. A.U.—arbitrary units. Data pass normality and equal variance and are graphed as means ±SEM. Brightness and contrast adjusted for graphical clarity of autoradiograph and Western blot images.

