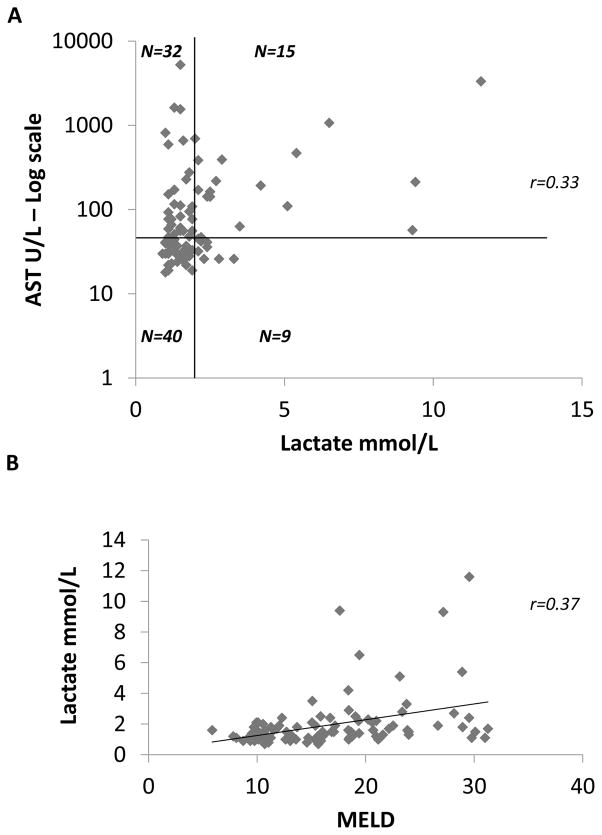
Figure 5. Distribution of AST and MELD score relative to plasma lactate.
The value of plasma lactate weas plotted against Aspartate Amino Transferase in U/l and MELD score for each patient on a scatter plot. The relationship between AST and lactate is represented in panel A. The upper limit of normal AST (47 U/l) is marked by a horizontal black line and the upper limit of normal plasma lactate (2.1 mmol/L) is marked by a vertical black line identifying 4 quadrants: normal lactate/normal AST (lower left, n=40), normal lactate and elevated AST (upper left, n=32), elevated AST and elevated lactate (upper right, n=15), elevated lactate and normal AST (lower right, n=9). The values of AST are plotted on a log scale. There is a weak linear correlation between AST and plasma lactate as shown by a Spearman correlation coefficient r=0.33 (p<0.001). In panel B plasma lactate levels are plotted against MELD score. There is a weak linear correlation also between MELD score and plasma lactate as shown sy a Spearman correlation coefficient r=0.37 (p<0.001).

