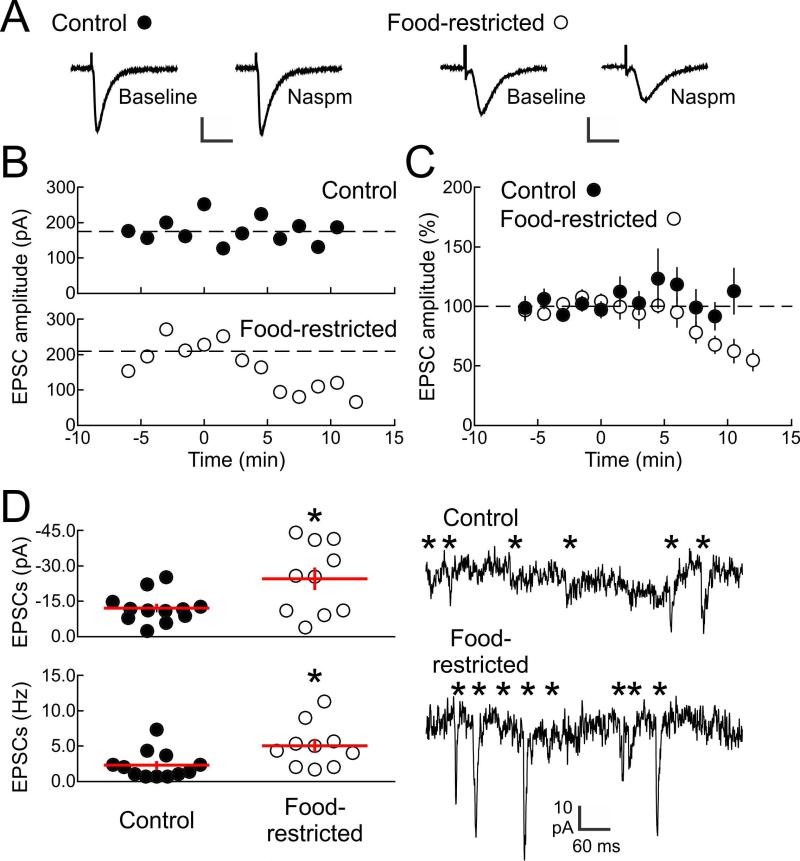
Figure 5.
Incorporation of CP-AMPARs into NAc shell excitatory synapses after food restriction. A: Example evoked EPSCs from NAc shell neurons of AL control (left, scale: 30 ms, 100 pA) and FR (right, scale: 20 ms, 250 pA) rats. EPSCs were isolated in picrotoxin (50 μM) and measured before and after Naspm washin (200 μM). B: Time course of Naspm washin for example cell from AL control animal (top, filled circles) and FR animal (bottom, open circles). EPSCs from AL animal were unaffected by Naspm 3+ min after washin (baseline amplitude: 174.1±9.9 pA, amplitude 3+ minutes after Naspm washin: 176.3±13.2 pA, t(8)=0.12, p=.9), while EPSCs from FR animal were reduced (baseline amplitude: 208.4±24.6 pA, amplitude 3+ minutes after Naspm washin: 117.1±16.4 pA, t(9)=3.2, p=.01). Naspm washin occurred at time 0. C: Summary data across all cells showing that EPSCs from AL animals were unaffected by Naspm 3+ min after washin (109.1±12.4% of control amplitude, n=12 neurons, t(11)=0.73, p=.47), while EPSCs from FR animals were reduced (70.6±11.0% of control amplitude, n=7 neurons, t(6)=2.7, p=.02 compared to baseline; t(17)=2.1, p=.033 compared to neurons from AL animals). Naspm washin occurred at time 0. D: Analysis of spontaneous EPSCs recorded in AL and FR animals. Top left: summary of mean spontaneous EPSC amplitudes (AL: −12.1±1.8 pA, FR: −24.6±4.8 pA, t(20)= 6.8, *p<.0001). Bottom left: summary of mean spontaneous EPSC frequencies (AL: 2.3±0.6 Hz, FR: 5.0±1.0 Hz, t(20)=4.8, *p=.0001). Right: example recordings of spontaneous EPSCs. * individual detected spontaneous events.

