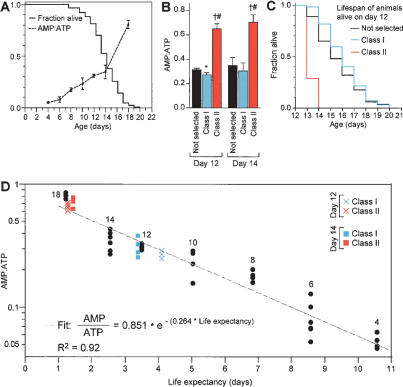
Figure 1.
The AMP:ATP ratio predicts life expectancy. (A) Survival curve and increasing AMP:ATP ratio with age. fem-1(hc17); fer-15(b26) animals were grown at 25°C; their lack of sperm at this temperature facilitates growing a large number of animals. In parallel cultures, either the number of surviving animals or adenine nucleotide measurements were recorded at the times indicated. (B) AMP:ATP ratios of 12- and 14-d animals divided based on their motility. “Not selected” represents a group of animals that was not separated based on motility. ★P < 0.01 and †P < 0.0001, compared with “not selected”; #P < 0.0001 compared with Class I (unpaired t-test). (C) Survival curves of 12-d Class I or Class II or “not selected” animals based on motility. Similar data were obtained for 14-d animals. For statistical data on lifespans see Supplementary Table 1. (D) Least squares regression of the AMP:ATP ratio as a function of life expectancy of animals described in A. The age of “not selected” animals is noted next to the data points. The fit and R2 values were determined from “not selected” animals only. Twelve- and fourteen-day Class I and Class II animals were plotted on this graph according to AMP:ATP ratio and life expectancy (measured in B,C); actual life expectancy closely correlated with values predicted based on AMP:ATP ratio. The increase in the AMP:ATP ratio with age is not due solely to an increase in the fraction of Class II relative to Class I animals, because the AMP:ATP ratio of day-12 Class I animals is higher than that of day-4 animals, which are all Class I (P < 0.0001, unpaired t-test).

