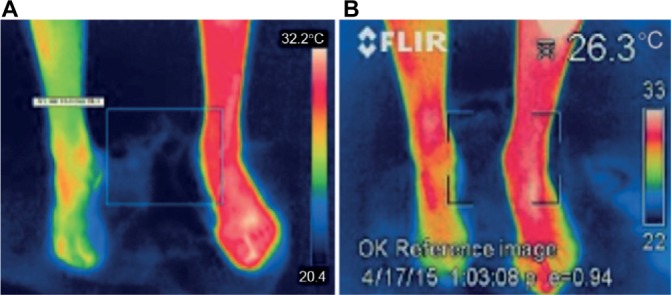
Figure 6.

Thermographic effect of stimulation of the right leg in patient 5 demonstrated on the controlled visit after 1 month.
Note: (A) Shows both feet before stimulation and (B) after 30 min of stimulation.

Thermographic effect of stimulation of the right leg in patient 5 demonstrated on the controlled visit after 1 month.
Note: (A) Shows both feet before stimulation and (B) after 30 min of stimulation.