Figure 2.
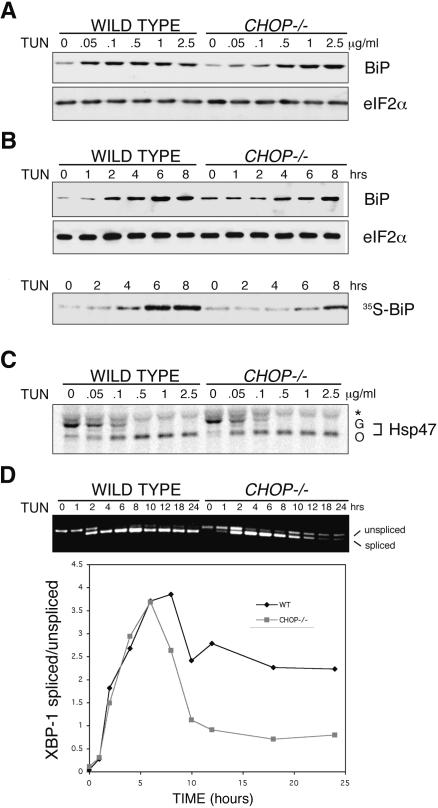
Lower levels of ER stress in tunicamycin-treated CHOP-/- cells. (A) Immunoblots of BiP and eIF2α (a loading control) from wild-type and CHOP-/- cells treated with varying doses of tunicamycin for 6 h. (B) Immunoblots as in A of cells treated with 0.5μg/mL tunicamycin for the indicated period of time (top two panels) and autoradiograph of immunoprecipitated newly synthesized [35S]BiP following pulse labeling of the treated cells (bottom). (C) Autoradiograph of 35S-labeled Hsp47 immunoprecipitated from wild-type and CHOP-/- cells briefly pulsed with [35S]methionine after 1 h of exposure to the indicated concentration of tunicamycin. The position of the glycosylated (G) and nonglycosylated (O) forms of Hsp47 on the SDS-PAGE are indicated. Also indicated is an irrelevant band immunoprecipitated by the anti-Hsp47 antiserum (★) (D) Ethidium bromide-stained gel of unspliced and IRE1-spliced XBP-1 RT-PCR product (reporting on mRNA) following a time course of tunicamycin treatment (0.5 μg/mL). The ratio of spliced/unspliced RNA in each sample in the two genotypes is also presented graphically.

