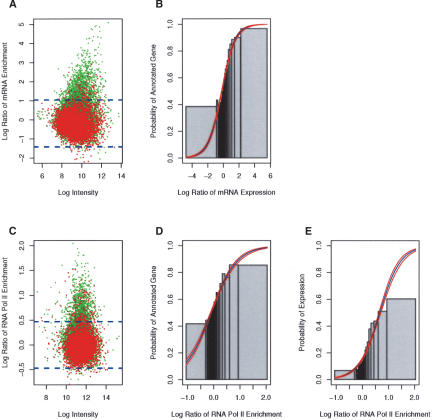
Figure 2.
Analysis of the transcriptome in Kc cells. (A) mRNA expression along the array matches the chromosome annotation (Celniker and Rubin 2003). A scatter plot of the mean log ratio of mRNA expression versus the average log intensity of each site on the array. The red and green spots indicate intergenic and intragenic sites on the array, respectively. A site was scored intragenic if it had any overlap with an annotated gene. The dashed blue line represents the confidence level (p < 0.01) of the enrichment. Note, that the majority (>85%) of enriched sites overlap with the annotated genes. (B) Probability of an annotated transcript increases with mRNA expression levels. Logistic regression was used to model the probability of a site being annotated as a gene as a function of mRNA expression. The blue and red lines represent the modeled probability and confidence levels, respectively. The Likelihood Ratio (L.R. = 1511) is a “goodness of fit” test statistic comparing the fit of the modeled data to the fit of the null model. The L.R. has a χ2 distribution with one degree of freedom. The fitted model is significantly (p < 10-16) different from the null hypothesis. For comparison, the raw data was ordered by mRNA expression and sorted into bins of 200 (gray bars). The height of the gray bars is the fraction of annotated genes in each of the bins. The width of the bar represents the range of mRNA expression for each bin. (C) RNA Pol II enrichment matches the chromosome annotation. See above for details. (D) Same as B, except using RNA Pol II (L.R. = 798, p < 10-16). (E) Logistic regression modeling the probability a site is expressed (determined from mRNA enrichment) as a function of RNA Pol II enrichment (L.R. = 1288, p < 10-16).

