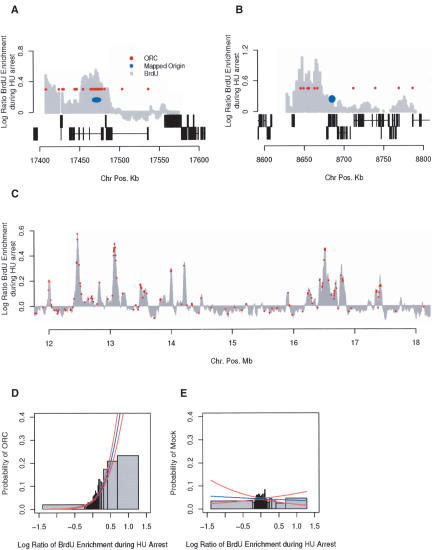
Figure 5.
Identification of ORC-binding sites. (A) Replication of the DNA Pol α locus on chromosome 3R. The gray histogram represents sites of BrdU incorporation during HU arrest (early activating origins), the red circles represent ORC-binding sites, and the blue oval represents a zone of replication initiation previously mapped by two-dimensional gel electrophoresis (Shinomiya and Ina 1994). The gene structure for both the Watson and Crick strands for 130 kb surrounding the DNA Pol α locus is depicted below the histogram. Exons are indicated as black boxes connected by a horizontal black line. (B) Replication of the chorion locus on chromosome 3L. (C) A total of 491 ORC-binding sites were identified on chromosome 2L by genome-wide location analysis. A subset of ORC-binding sites are shown in red overlaid on a portion (6 Mb) of the early activating origins (gray histogram). The ORC-binding sites represent <5% of the analyzed data points. (D) The probability of finding ORC associated with the DNA increases with BrdU enrichment at early origins. Logistic regression was used to model the probability of a sequence being associated with ORC as a function of BrdU enrichment during HU-arrest (L.R. = 265, p < 10-16). (E) Same as D, but using 491 sites from a mock immunoprecipitation (L.R. = 0.08, p < 0.777).

