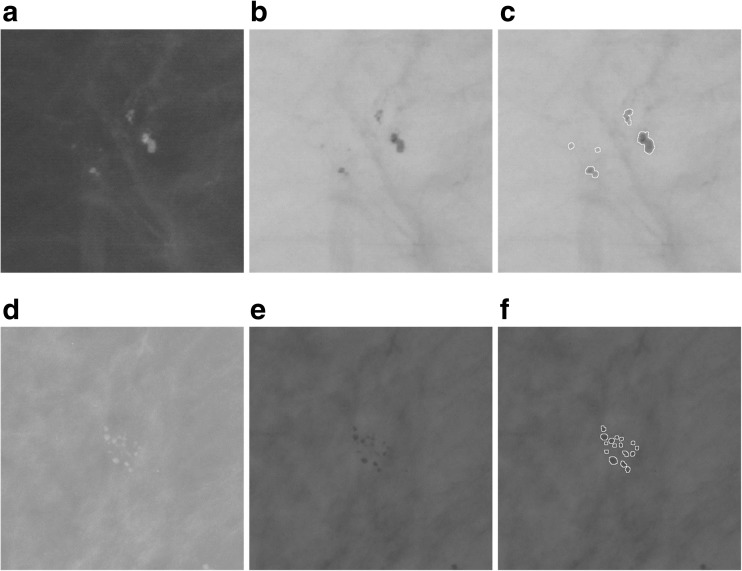
Fig. 2.
Two examples of patches with microcalcifications: benign (upper row, based on the image A_1551_1.LEFT_MLO), malignant (lower row, based on the image A_1214_LEFT_MLO). First column: mammographic image patches. Second column: the image inverted in gray levels. Third column: segmentation—all microcalcifications have been marked

