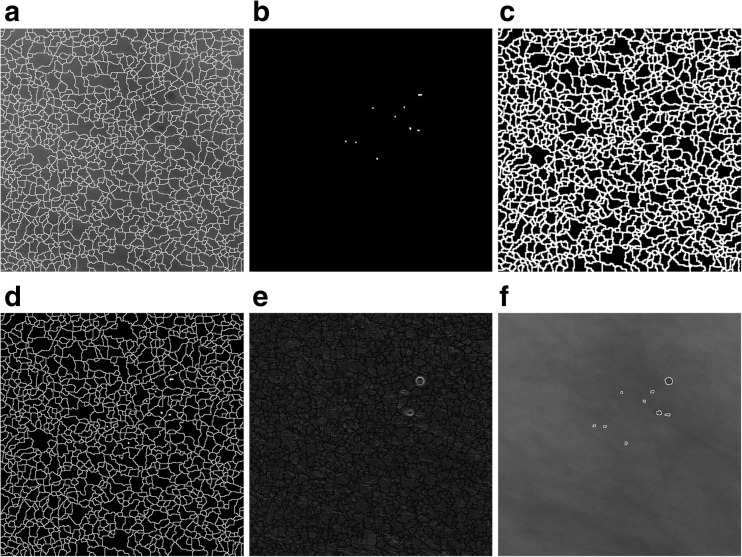
Fig. 5.
An illustration of extracting the microcalcifications shape. Part 2. a The result of the watershed segmentation, i.e., the external marker that has been overlaid on the image from Fig. 4b. b The internal marker. c The dilation of the external marker from item (a). d The logical sum of the external and internal markers. e The result of the minima imposition operation for the gradient image from Fig. 4f and the complete marker from Fig. 5d. f Output watershed lines overlaid on the image from Fig. 4b

