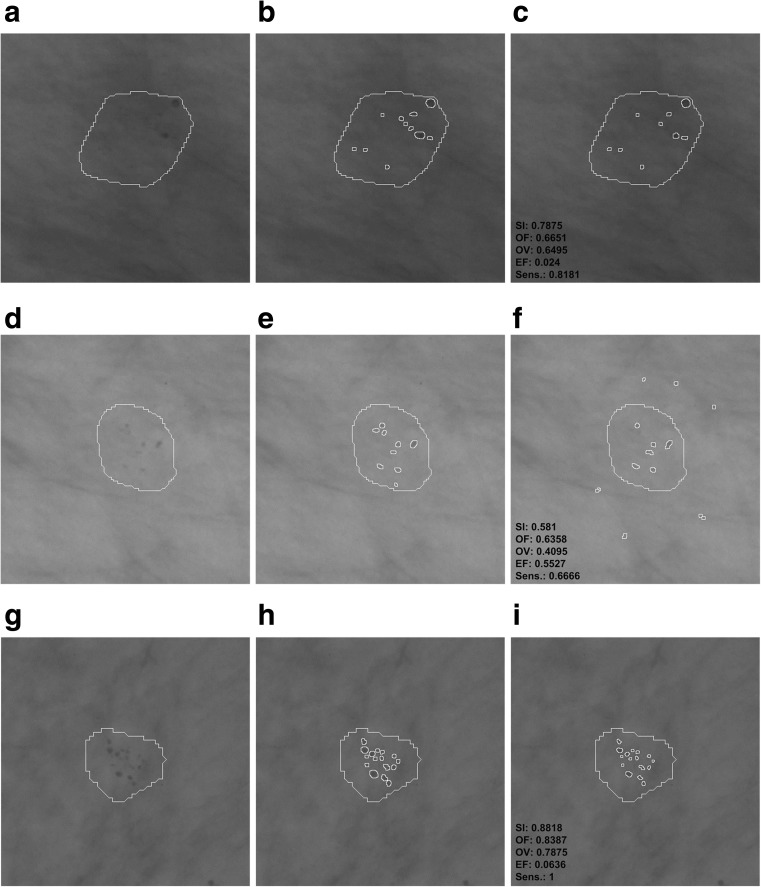
Fig. 9.
Malignant cases—example results of microcalcification segmentation for selected mammograms from the DDSM database, together with the GTA contours marked. The images have been inverted in the gray scale to better bring out individual microcalcifications. First column: the GTA contour marked. Second column: contours of individual microcalcifications traced by a radiologist. Third column: results of segmenting microcalcifications using the computer method, with the calculated indices. a–c Image A_1131_1.RIGHT_MLO. d–f A_1201_1.RIGHT MLO. g–i A_1214_1.LEFT MLO

