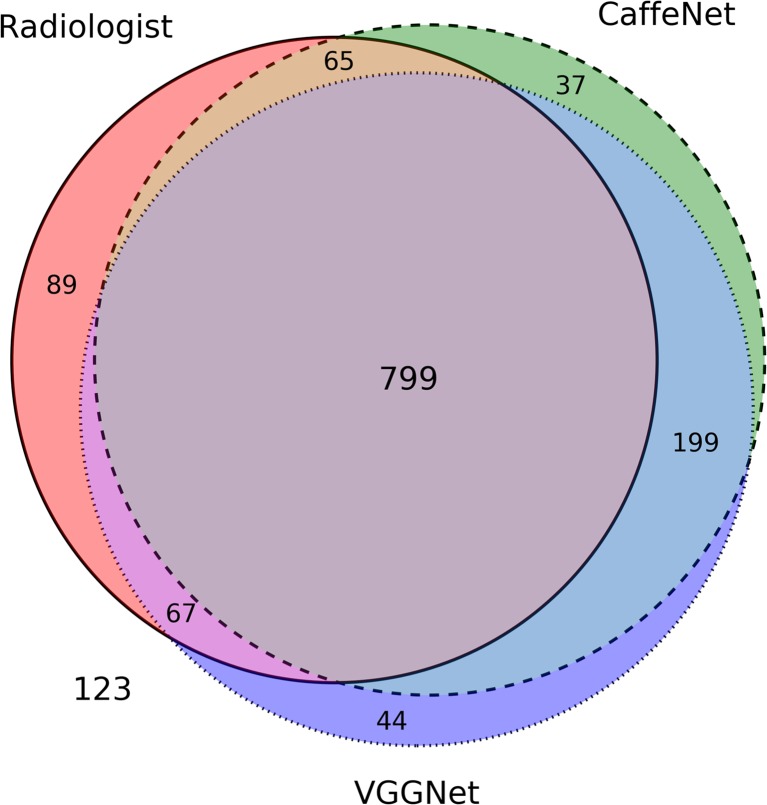
Fig. 4.
Venn diagram for images correctly classified by the two neural networks (CaffeNet = dashed circle, VGGNet = dotted circle) and the radiologist (solid circle). The areas of the diagram are approximately proportional to the number of images; the large common area in the center represents the 799 images classified correctly by both neural networks and the radiologist. A total of 123 images were incorrectly classified by both neural networks and the radiologist

