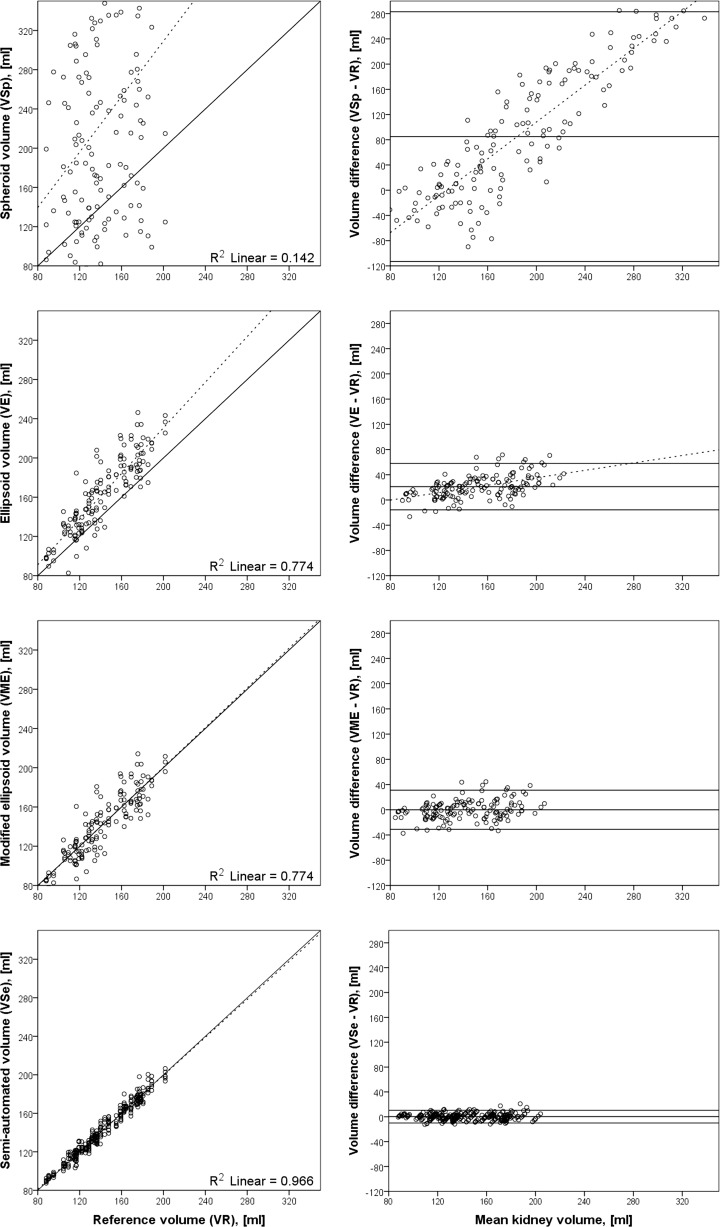
Fig. 6.
Correlation of different segmentation approaches plotted against the reference volume (left) and the corresponding Bland–Altman plots of difference of volumes plotted against mean total kidney volume (right). The spheroid volume (V Sp) scatters widely without any visible correlation to the reference volume (V R). The ellipsoid volume (V E) shows a better correlation. The volume of the renal pelvis and the hilus of the kidney were included in this geometrical calculation and the volumes were systematically too high. To compensate for this and to estimate only the parenchymal volume, we calculated the modified ellipsoid volume (V ME) by subtracting 15% from V E (V ME = V E × 0.85). Compared with the fast measurements and volume estimations, the semi-automatic volume has the highest correlation and the narrowest confidence interval

