Figure 6.

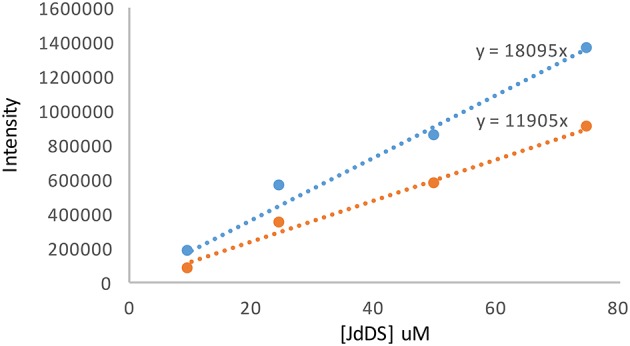
Calibration curves for JdDS quantification using LC-MS2. The blue line corresponds to the area beneath the parent ion [M+H]+ m/z 524 and the orange line to the area beneath the fragment ion m/z 394.

Calibration curves for JdDS quantification using LC-MS2. The blue line corresponds to the area beneath the parent ion [M+H]+ m/z 524 and the orange line to the area beneath the fragment ion m/z 394.