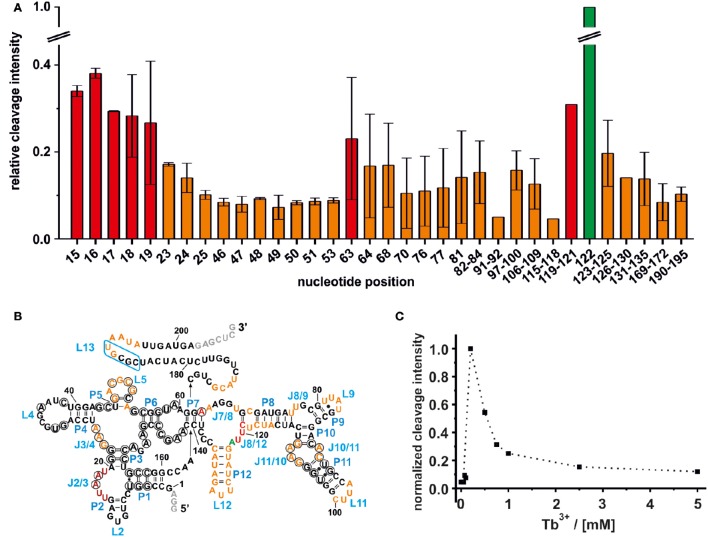
Figure 2.
Mapping of the Mn+ binding sites on the ligand free btuB riboswitch of E. coli. (A) The relative cleavage intensity at the indicated nucleotides at 0.5 mM TbCl3 and 20 mM Mg2+ by nucleotide is displayed. Sites not showing any intensity change are not displayed. Shown is the average of two gels with the respective range while the cleavage intensity was normalized to the strongest cleavage found at A122. Weak cleavage sites (up to 0.2 relative cleavage intensity) are shown in orange, strong cleavage sites (up to 0.4 relative cleavage intensity) are shown in red, and the strongest cleavage site is shown in green. (B) Mapping of the Mn+ binding sites on the secondary structure of the btuB riboswitch. Nucleotides in black circles indicate the conserved bases from the consensus sequence of AdoCbl riboswitches (Nahvi et al., 2004). The blue box indicates the L13 region supposedly undergoing the kissing loop interaction with L5 upon AdoCbl binding. Nucleotides in gray were added to the original btuB sequence at both the 3′- and 5′-end to enhance the transcription yield (Choudhary and Sigel, 2014). (C) The change in cleavage intensity at A122 (J8/12) as a function of TbCl3 concentration derived from one representative experiment.

