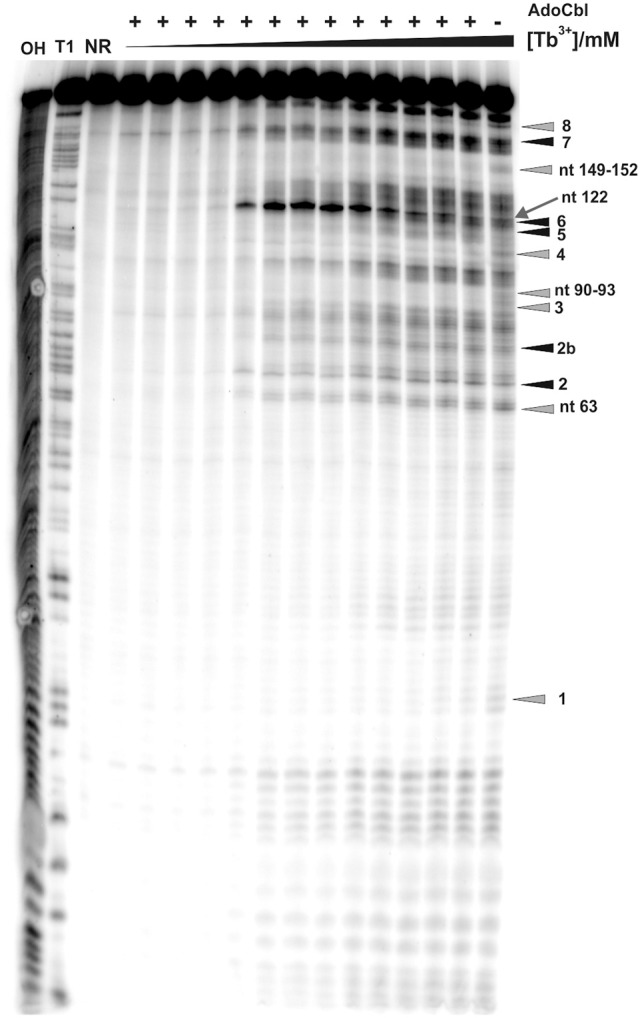
Figure 4.

Tb3+ cleavage of the ligand bound btuB riboswitch. The RNA was prefolded in the presence of 100 μM AdoCbl and then incubated with increasing concentrations of TbCl3 (from left to right, 0.0, 0.025, 0.05, 0.1, 0.25, 0.5, 0.75, 1.0, 2.5, 5.0, 10, 15, 20 mM). The arrow shows nucleotide A122 displaying the strongest cleavage of all sites within the btuB riboswitch. Triangles in gray and black indicate the nucleotides with decreased and increased cleavage in the presence of AdoCbl (Supplementary Figure 4). The cleavage patterns of the two lanes on the right [20 mM Tb(III), ± AdoCbl] were used for the structural footprints shown in Figure 6. The numbered cleavage bands indicated on the right side correspond to the previously described in-line probing bands (Gallo et al., 2008). OH, Alkaline hydrolysis ladder; T1, RNase T1 ladder; NR, non-reacted RNA.
