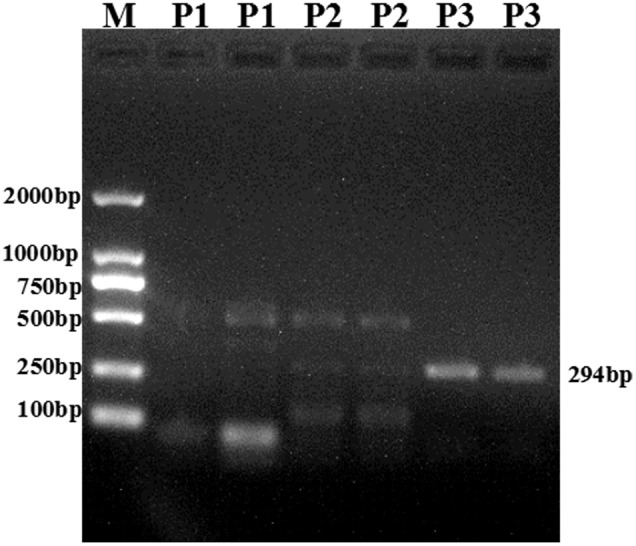
FIGURE 2.

The PCR product was run and visualized on 1.0% agarose gel and a clear band (294 bp) was obtained for primer 3 (P3). The Marker (M) 2 Kbp was loaded in Lane1, while the three different PCR products were loaded in the consecutive lanes (P1; Lane 2, 3 P2; Lane 4, 5 and P3; Lane 6, 7). The molecular weight (bp) corresponding to the DNA ladder is indicated on the left side.
