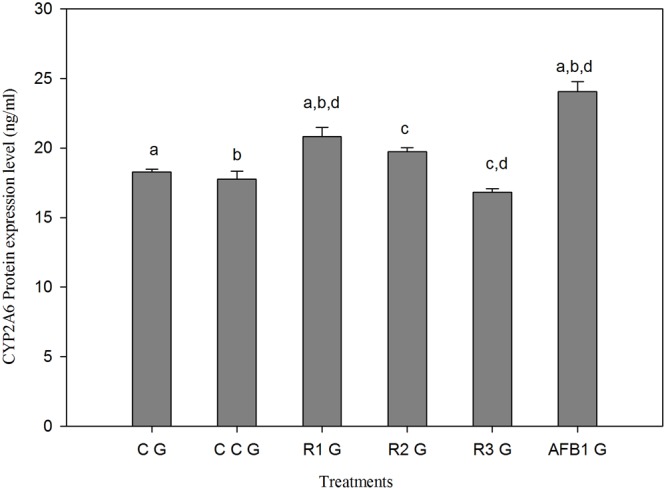
FIGURE 6.

The effect of AFB1, curcumin and AFB1-curcumin treatment on protein expression of CYP2A6 relative to control group. The value of P < 0.05 was considered statistically significant. The data represented as mean ± SE (n = 3). The groups represented as CG = Control group (fed only basal diet), CCG = Curcumin control group (450 mg curcumin/kg feed), R1G = 150 mg curcumin + 5.0 mg AFB1/kg feed, R2G = 300 mg curcumin + 5.0 mg AFB1/kg feed, R3G = 450 mg curcumin + 5.0 mg AFB1/kg feed, AFB1 G = 5.0 mg AFB1/kg feed. Different superscript letters indicate that means significantly different according to Tukey’s HSD test (p ≤ 0.05).
