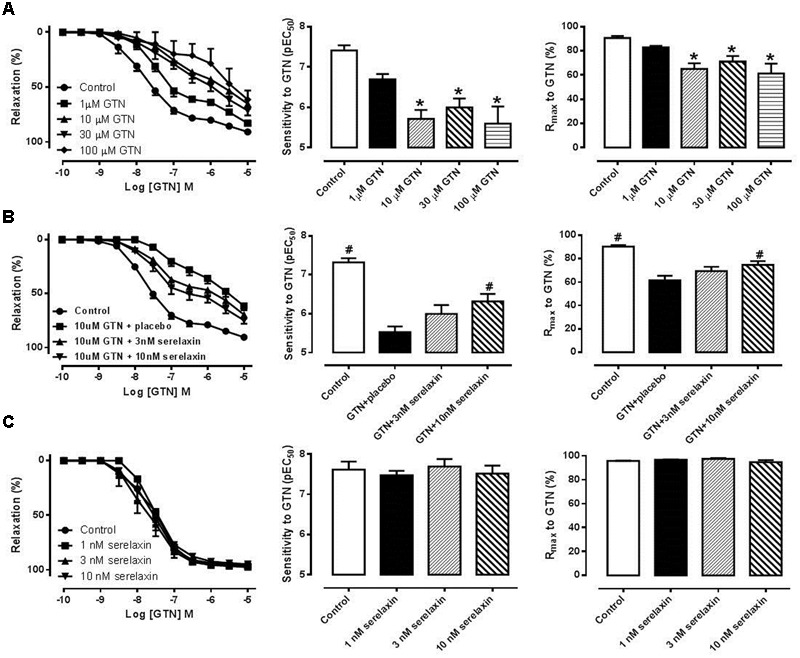
FIGURE 1.

(A) Concentration-response curves, sensitivity (pEC50) and maximum relaxation (Rmax) to GTN after 1 h incubation of (A) either control or GTN (1, 10, 30, 100 μM), (B) control, 10 μM GTN+placebo, 10 μM GTN+3 nM serelaxin, 10 μM GTN+10 nM serelaxin, (C) either placebo or serelaxin (1, 3, 10 nM), followed by 1 h washout. Data are expressed as mean ± SEM, n = 5–8 per group. ∗P < 0.05 compared to control (one-way ANOVA, Dunnett’s test) #P < 0.05 vs. 10 uM GTN+placebo (one-way ANOVA, Dunnett’s test).
