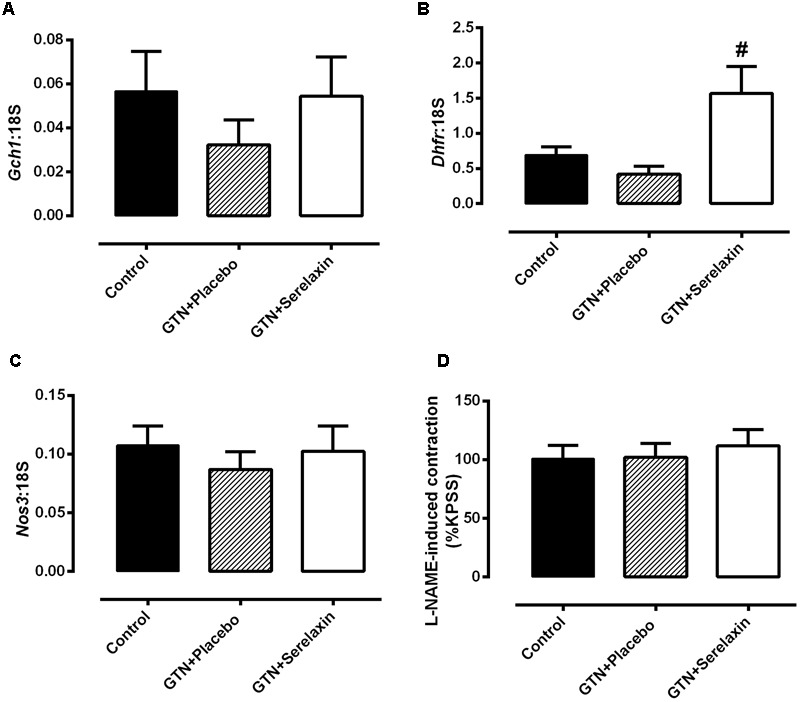
FIGURE 6.

Quantitative analysis of (A) Gch1, (B) Dhfr, and (C) Nos3 mRNA expression in the aorta from control, GTN+placebo or GTN+serelaxin rats for 3 days. (D) Basal NOS activity in endothelium-intact aorta from control, GTN+placebo or GTN+serelaxin rats for 3 days. In each group of experiments, aortae were pre-contracted with phenylephrine (PE) to a similar level (∼20% of KPSS contraction) before the addition of L-NAME (200 μmol L-1). n = 5–8 per group. Values are 2-ΔCt ± SEM. # significantly different to GTN+placebo, P < 0.05 (one-way ANOVA, Tukey’s post hoc test).
