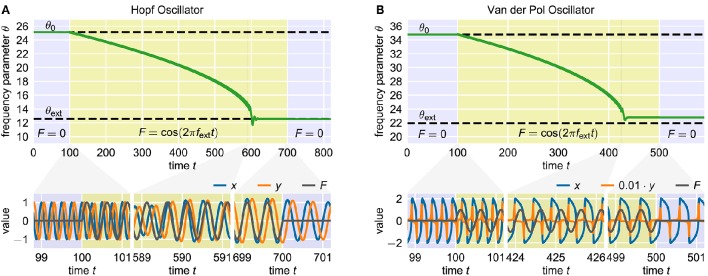
Figure 1.
Adaptation of two standard adaptive frequency oscillators. The upper panels show the time course of the frequency determining parameter θ. The time during which the external signal is applied to the system is indicated by the yellow shaded area. The dashed horizontal lines indicate the values θ0 and θext corresponding to the initial intrinsic frequency f0 and the target frequency fext of the external signal, respectively. The panels below show the oscillating state variables x and y and the external signal F at different short time windows during the adaptation process. In both cases, the initial intrinsic frequency of the oscillator is f0 = 4.0 and the external signal is a sine wave with unit amplitude and frequency fext = 2.0. (A) Adaptive frequency Hopf oscillator with μ = 1.0 and ϵ = η = 1.0 (see Methods). The initial value of the parameter θ is given by θ0 = 2πf0 ≈ 25.1. Accordingly, the value corresponding to the frequency of the external signal is θext = 2πfext ≈ 12.6. The external signal is applied for 100 ≤ t < 700. (B) Adaptive frequency Van der Pol oscillator with μ = 100.0 and ϵ = η = 0.7 (see Methods). The values of the parameter θ corresponding to f0 and fext are θ0 ≈ 34.8 and θext ≈ 22.0 (see Methods). The external signal is applied for 100 ≤ t < 500.

